- Line plot:
pl.plot(x,y) or pl.plot(x,y,':') # see line types below
pl.step(x,y,'mid') # for step plot, with keywords 'pre', 'mid' and 'post'.
- Scatter plot:
pl.plot(x,y,'or') # red dots, see symbol types and colors below
- Histogram:
data = np.random.normal(5.0, 3.0, 1000) # make an array of 1000 random number with a mean of 5 and rms of 3.
pl.hist(data)

# user define bin:

bins = np.arange(-5., 16., 1.) #floating number ranges
pl.hist(data, bins, histtype=’stepfilled’) - Annotation:
pl.title(’Plot of y vs. x’)# give plot a title
pl.xlabel(’x axis’)# make axis labels
pl.ylabel(’y axis’) - Axis ranges and scales:
pl.xlim(0.0, 7.0)# set axis limits
pl.ylim(0.0, 30.)
fig = plt.figure()
ax = fig.add_subplot(111)
ax.semilogx(x,y) #x轴为对数坐标轴
ax.semilogy(x,y) #y轴为对数坐标轴
ax.loglog(x,y) #双对数坐标轴
- Legends:
plot1 = pl.plot(x1, y1, ’r’)# use pylab to plot x and y : Give your plots names
plot2 = pl.plot(x2, y2, ’go’)
pl.legend([plot1, plot2], (’red line’, ’green circles’), ’best’, numpoints=1)

# the 3rd parameter is positioning of the legend, which takes one of the following values:
'best’, ‘upper right’, ‘upper left’, ‘center’, ‘lower left’, ‘lower right’
Alternatively,
pl.plot(x1, y1, 'r', label='red line')
pl.plot(x2, y2, 'go', label='green circles')
pl.legend()
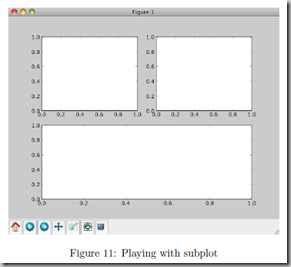
- Multiple subplots:
pl.subplot(numRows, numCols, plotNum)
# the last number specify which subplot is made as the current subplot
# (subplot index sequence: top to bottom, left to right).
# when all three numbers are <10, pl.subplot(3,2,2) is equivalent to pl.subplot(322)

f1 = pl.figure(1)
pl.subplot(221)
pl.subplot(222)
pl.subplot(212)

# The last command remove the original two subplots in the second row and creat a new single subplot according to the new 2*1 format.
# As an example, if we want to make a plot in the second (upper right) subplot:

pl.subplot(222)  # make this subplot current. Alternatively, if we have defined ax2=pl.subplot(222), we can use pl.sca(ax2) here.
pl.plot(x,y)

# fine tune the positions of subplots (when the default layout is not satisfactory):

pl.subplots_adjust(left=0.08, bottom=0.95, wspace=0.25, hspace=0.45) # in units of the width/height of the plot region (also 'right', 'top').
- Show the plot: pl.show()
- Save figure:
pl.savefig(fname, dpi=None, facecolor='w', edgecolor='w', orientation='portrait', papertype=None, format=None, transparent=False, bbox_inches=None, pad_inches=0.1, frameon=None)
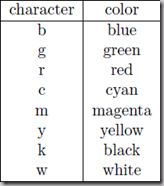
- plot colors:

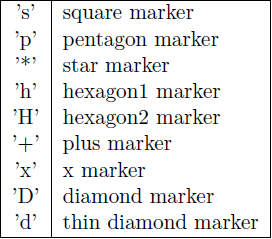
- plot symbols:

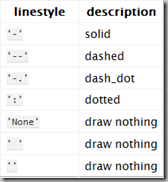
- plot line types:

- (Copied from http://www.cnblogs.com/emanlee/p/3616755.html)
(Use them by invoke "import string".) - 生成字符串变量
str='python String function' - 字符串长度获取:len(str)
例:print '%s length=%d' % (str,len(str)) - 连接字符串
sStr1 = 'strcat'
sStr2 = 'append'
sStr1 += sStr2
print sStr1 - 复制字符串
#strcpy(sStr1,sStr2)
sStr1 = 'strcpy'
sStr2 = sStr1
sStr1 = 'strcpy2'
print sStr2 - 比较字符串
#strcmp(sStr1,sStr2)
sStr1 = 'strchr'
sStr2 = 'strch'
print cmp(sStr1,sStr2)
#注意cmp函数的输出结果和C语言的strcmp是一样的。还可以用 “aaa”==“bbb” 来比较字符串。 - 截取字符串
特别注意:下标从0开始;str[0:3]不包含下标为3的字符。
str = ’0123456789′
print str[0:3] #截取第一位到第三位的字符
print str[:] #截取字符串的全部字符
print str[6:] #截取第七个字符到结尾
print str[:-3] #截取从头开始到倒数第三个字符之前
print str[2] #截取第三个字符
print str[-1] #截取倒数第一个字符
print str[::-1] #创造一个与原字符串顺序相反的字符串
print str[-3:-1] #截取倒数第三位与倒数第一位之前的字符
print str[-3:] #截取倒数第三位到结尾
print str[:-5:-3] #逆序截取,具体啥意思没搞明白? - 字符串中的搜索和替换:
S.find(substr, [start, [end]]) #返回S中出现substr的第一个字母的标号,如果S中没有substr则返回-1。start和end作用就相当于在S[start:end]中搜索
S.index(substr, [start, [end]]) #与find()相同,只是在S中没有substr时,会返回一个运行时错误
S.rfind(substr, [start, [end]]) #返回S中最后出现的substr的第一个字母的标号,如果S中没有substr则返回-1,也就是说从右边算起的第一次出现的substr的首字母标号
S.rindex(substr, [start, [end]])
S.count(substr, [start, [end]]) #计算substr在S中出现的次数
S.replace(oldstr, newstr, [count]) #把S中的oldstr替换为newstr,count为替换次数。这是替换的通用形式,还有一些函数进行特殊字符的替换
S.strip([chars]) #把S中前后chars中有的字符全部去掉,可以理解为把S前后chars替换为None
S.lstrip([chars])
S.rstrip([chars])
S.expandtabs([tabsize]) #把S中的tab字符替换没空格,每个tab替换为tabsize个空格,默认是8个
- 字符串的分割和组合:
S.split([sep, [maxsplit]]) #以sep为分隔符,把S分成一个list。maxsplit表示分割的次数。默认的分割符为空白字符
S.rsplit([sep, [maxsplit]])
S.splitlines([keepends]) #把S按照行分割符分为一个list,keepends是一个bool值,如果为真每行后而会保留行分割符。
S.join(seq) #把seq代表的序列──字符串序列,用S连接起来
字符串的mapping,这一功能包含两个函数:
String.maketrans(from, to) #返回一个256个字符组成的翻译表,其中from中的字符被一一对应地转换成to,所以from和to必须是等长的。
S.translate(table[,deletechars]) # 使用上面的函数产后的翻译表,把S进行翻译,并把deletechars中有的字符删掉。需要注意的是,如果S为unicode字符串,那么就不支持 deletechars参数,可以使用把某个字符翻译为None的方式实现相同的功能。此外还可以使用codecs模块的功能来创建更加功能强大的翻译 表。 - 字符串中字符大小写的变换:
S.lower() #小写
S.upper() #大写
S.swapcase() #大小写互换
S.capitalize() #首字母大写
String.capwords(S) #这是模块中的方法。它把S用split()函数分开,然后用
capitalize()把首字母变成大写,最后用join()合并到一起
S.title() #只有首字母大写,其余为小写,模块中没有这个方法
- 字符串去空格及去指定字符
去两边空格:str.strip()
去左空格:str.lstrip()
去右空格:str.rstrip()
去两边字符串:str.strip('d'),相应的也有lstrip,rstrip
str=' python String function '
print '%s strip=%s' % (str,str.strip())
str='python String function'
print '%s strip=%s' % (str,str.strip('d')) - 字符串编码和解码的函数:
S.encode([encoding,[errors]]) # 其中encoding可以有多种值,比如gb2312 gbk gb18030 bz2 zlib big5 bzse64等都支持。errors默认值为"strict",意思是UnicodeError。可能的值还有'ignore', 'replace', 'xmlcharrefreplace', 'backslashreplace' 和所有的通过codecs.register_error注册的值。这一部分内容涉及codecs模块,不是特明白
S.decode([encoding,[errors]]) - 字符串的测试函数
这一类函数在string模块中没有,这些函数返回的都是bool值:
S.startwith(prefix[,start[,end]]) #是否以prefix开头
S.endwith(suffix[,start[,end]]) #以suffix结尾
S.isalnum() #是否全是字母和数字,并至少有一个字符
S.isalpha() #是否全是字母,并至少有一个字符
S.isdigit() #是否全是数字,并至少有一个字符
S.isspace() #是否全是空白字符,并至少有一个字符
S.islower() #S中的字母是否全是小写
S.isupper() #S中的字母是否便是大写
S.istitle() #S是否是首字母大写的 - python字符串与数字的转化
数字变为字符串 str()
- string.atoi(s[,base]) #base默认为10,如果为0,那么s就可以是012或0x23这种形式的字符串,如果是16那么s就只能是0x23或0X12这种形式的字符串
string.atol(s[,base]) #转成long
string.atof(s[,base]) #转成float - 字符串在输出时的对齐:
S.ljust(width,[fillchar]) #输出width个字符,S左对齐,不足部分用fillchar填充,默认的为空格。
S.rjust(width,[fillchar]) #右对齐
S.center(width, [fillchar]) #中间对齐
S.zfill(width) #把S变成width长,并在右对齐,不足部分用0补足 - 字符串中的单引号,双引号
用 \ 来转义。