|
Radiative Transfer in dusty medium
- spherical circumstellar shell
- circumstellar disk
- detached circumstellar shell
- ISM-interaction shell
- scattering
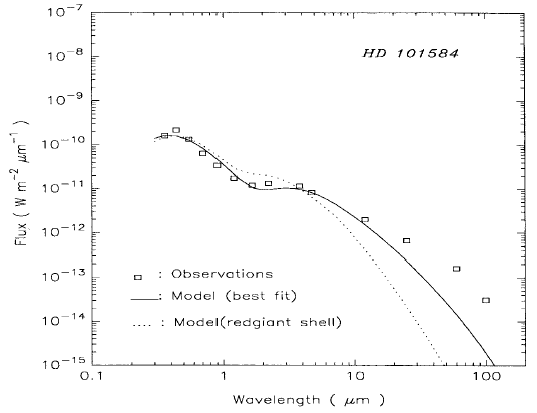
 | spherical
circumstellar shell
|
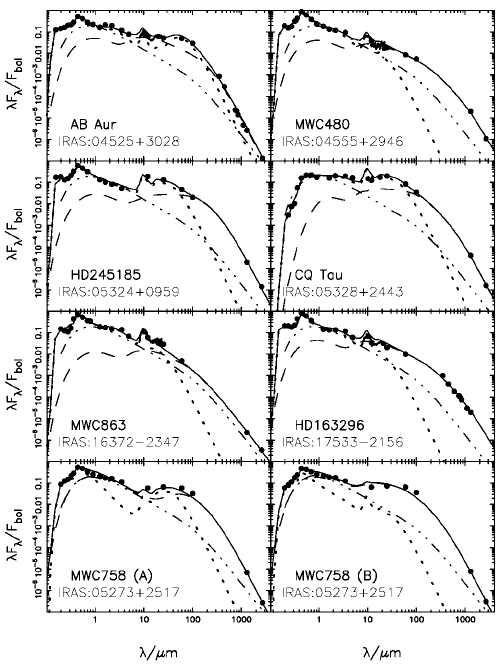
| circumstellar disks
 | 2D radiative hydrodynamical code and ray tracing code calculations
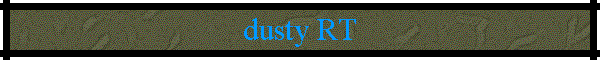
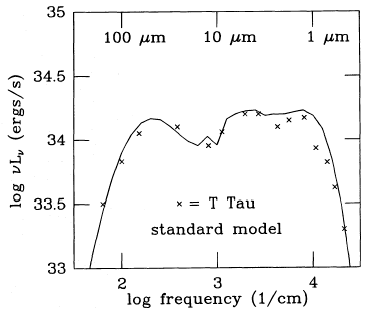
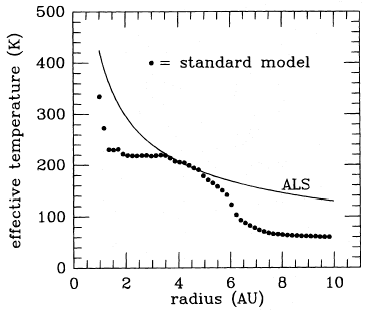
showed that the 10um dip in the SED of
pre-main sequence stars (PMS) can be fitted by a circumstellar
disk with inner gap. Parameter effects (disk
gap, disk inclination, disk mass, viscosity
heating effect) had been explored. Mid-plane density profile,
dust opacity, and star mass only have minor effects. See figures below.
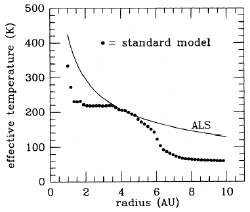
(from Boss et al. 1996ApJ...469..366B)
(figure: left--best fit of T Tau SED; right --
dust temperature distribution (dots) compared with power law temperature
distribution.)
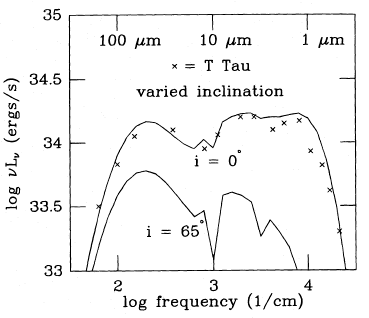
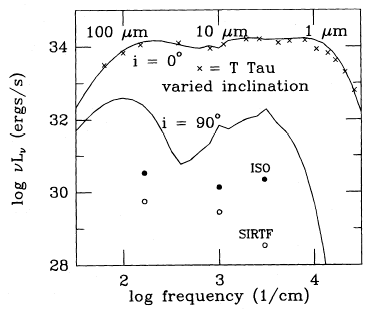
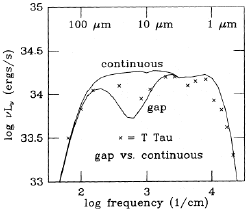
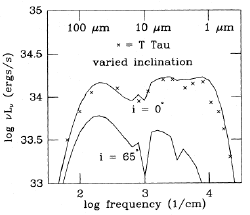
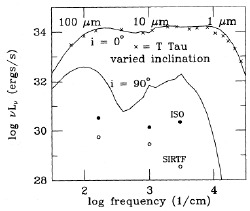
(figure: left--disk gap
effect; middle and right-- inclination effects (i=0 deg for pole on).
Note the change of 9.8 um silicate feature from absorption when i=60deg
to emission when i=90 deg (edge-on) and the edge-on emission is very
weak!.)
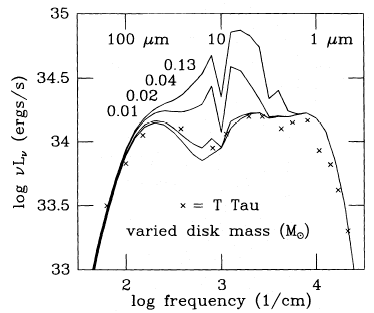
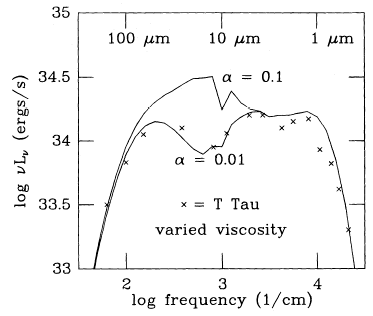
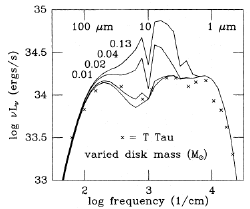
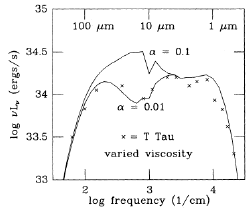
(figure: left--disk
mass effects; right -- viscosity heating effects.)
  |
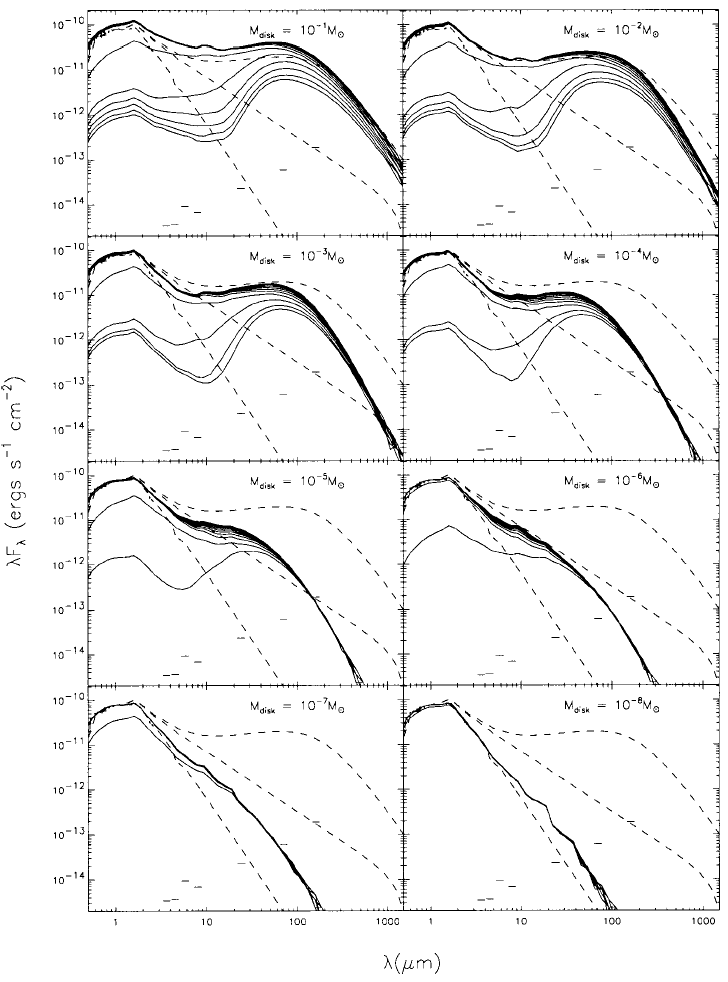
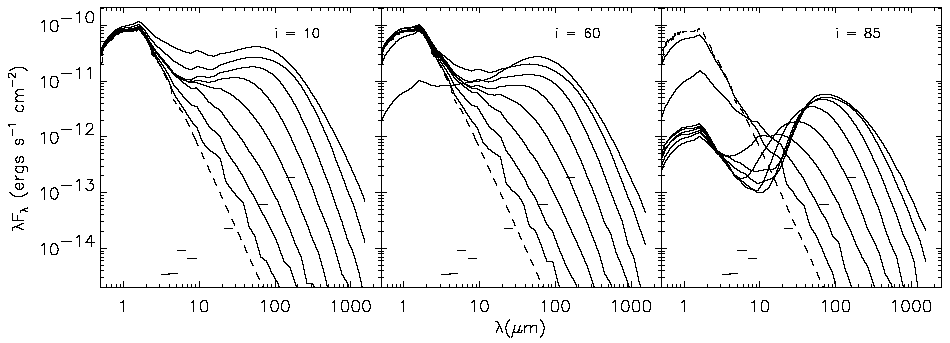
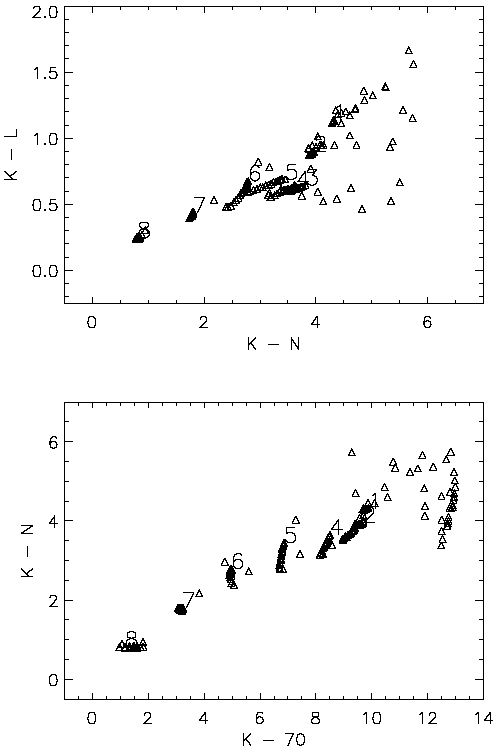
| Monte Carlo radiative transfer similations (including anisotropic
scattering) of geometrically thin but optically thick disk of small dust
grains show that most of the disk dust emission is in far-IR and longer wavelength. Decreasing mass of
the disk results in fast decrease of FIR strength, while near-IR
emission changes much less and keep to be optically thick to star light
down to a disk mass of 10-7 Msun. Therefore, NIR color excess is the best way to detect disk emission.
However, size of the inner hole of the disk
will strongly affect the NIR emission. Change of
disk mass produces a clear regression in color-color diagrams,
while disk inclination angle causes
degeneracies in color-mass relationship. Highly inclines disks (nearly edge on) are very faint and red and can be easily
identified in color-color diagrams. Compared with the disk mass and
inclination angle, other parameters such as outer
radius of the disk, flaring of disk
or not, dust size distributions only yields
quantitative effects. (from Wood et al., 2002, ApJ, 567, 1183)
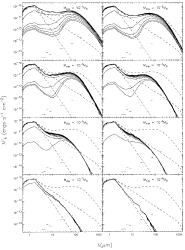
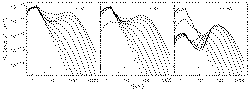
(figure: left--full
line curves are for different inclination angles with evenly distributed
cos(i) from i=87deg to i=13 deg from bottom to top in each pannel;
different pannels are for different disk masses; middle--figure:
effectes of different disk masses 10-8 Msun for lowest curve
to 10-1 Msun for the highest curve; different pannels are for
different inclination angles; right -- color-color diagram with different disk
masses and inclination angles..)
 |
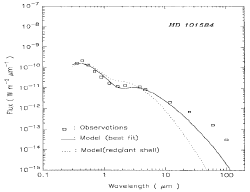
| DUSTY calculation of a geometrically thin but optically thick disk
enbedded in a spherical shell shows that the disk dust temperature
decreases according to r -0.75, while the shell dust
temperture decreases slower as r -0.36 (for dust opacity
~lambda^-1.5). As a result, the disk is much cooler than shell in the
co-exist region. This model can explain the compact dust emission in
millimeter (dominated by disk) and the SED in IR (dominated by shell) of
a sample of Herbig Ae/Be stars. The inner hole of the disk is also an
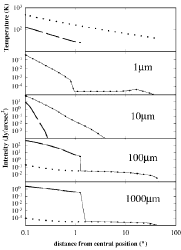
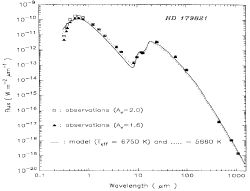
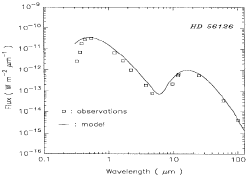
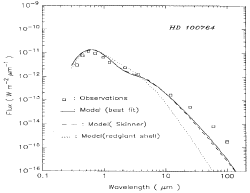
important factor. (from Miroshinechenko et al. 1999ApJ...520L.115M)
(figure: left --
Good fit of SED from UV to millimeter of a sample of Herbig Ae/Be stars
by the embedded disk model; right -- Dust temperature and intensity distribution
at different wavelengths. Dotted line--shell; broken line--disk; full
line--sum of shell and disk emission. Note that shell emission dominates
in IR while disk emission dominates in millimeter.)
  |
|
|
|
| detached
shell
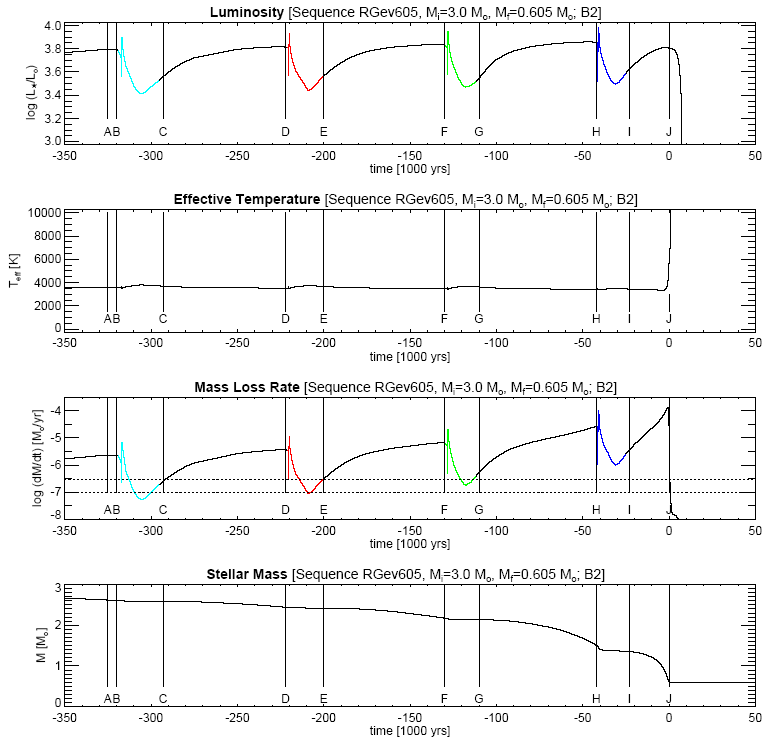
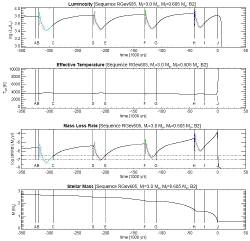
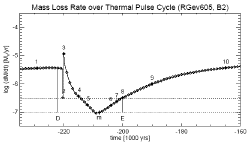
| Detached shells are usually thought to be formed by episodic intensive mass ejection events that are
very possibly induced by thermal pulses of an AGB star. A sophisticated
model including stellar evolution, hydrodynamics and dust radiative
transfer showed sequences of IR SED evolution progress during thermal
pulse cycles (last 4 TP, period of 9x10⁴ yr, ). It was shown
that the true reason (at least in this similation work) for the
formation of detached shell is the high mass loss
sustained for several 104 years that is interrupted by
extended minima after thermal pulse. But this work can not
explain geometrically thin shell observed in several stars. The short
period mass loss rate enhance ment caused dirctly by thermal pulse is
not the cause of detached shell due to too low amplitude and too short
time, neither does the interaction with ISM. However, many factors in
this model is still uncertain, e.g., grain
distribution, dust condensation efficiency, wind acceleration process
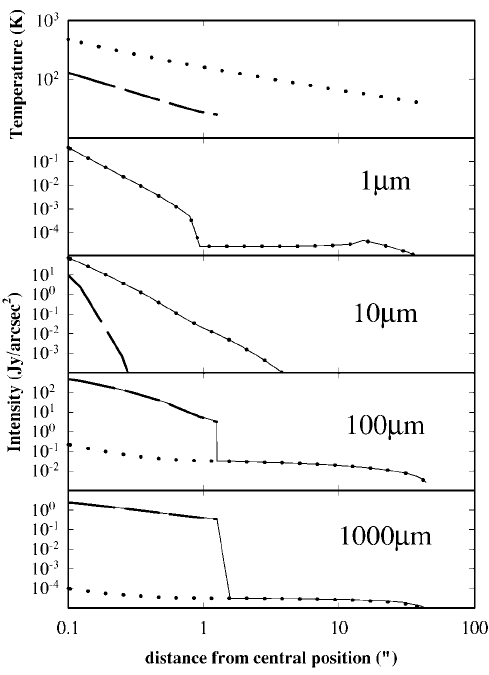
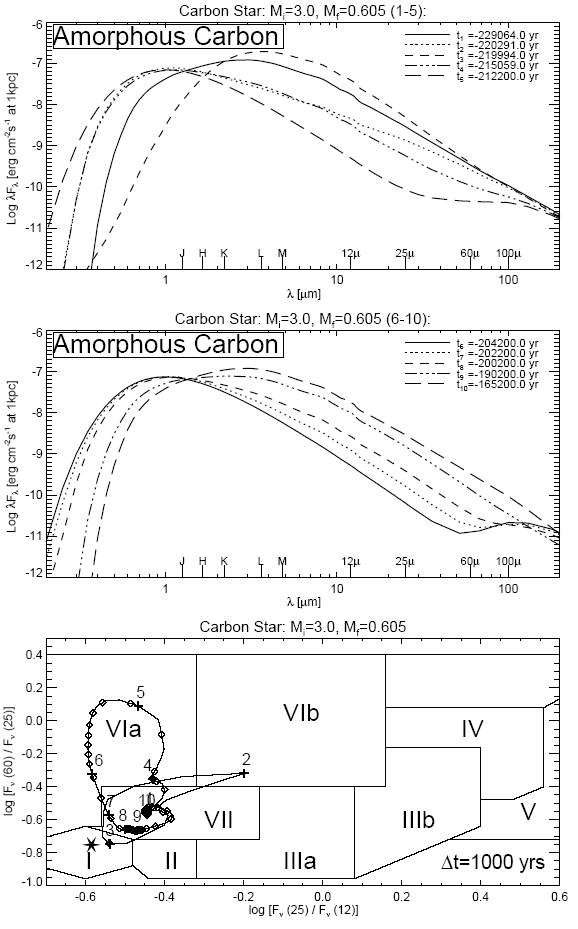
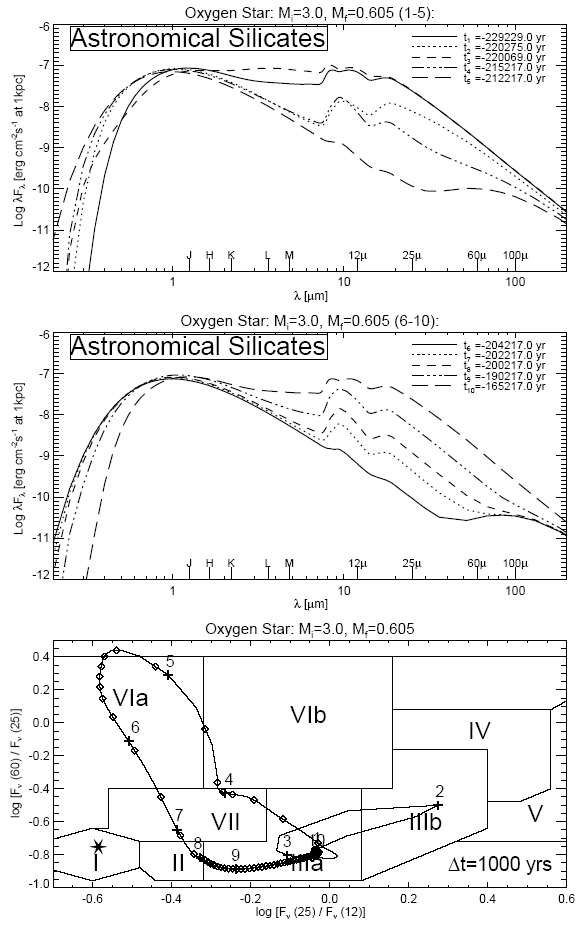
due to Mira type pulsation. (from Steffen et al., 1998A&A...337..149S)
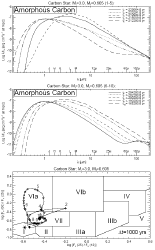
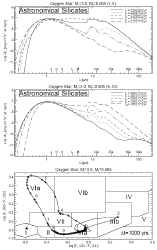
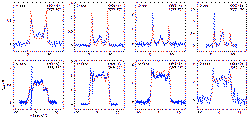
(figure: left -- model
of the last 4 TPs; middle left -- definition of time points; middle right -- SED and two-color diagram sequence for AC dust; right -- SED and two-color diagram sequence for silicates dust.)
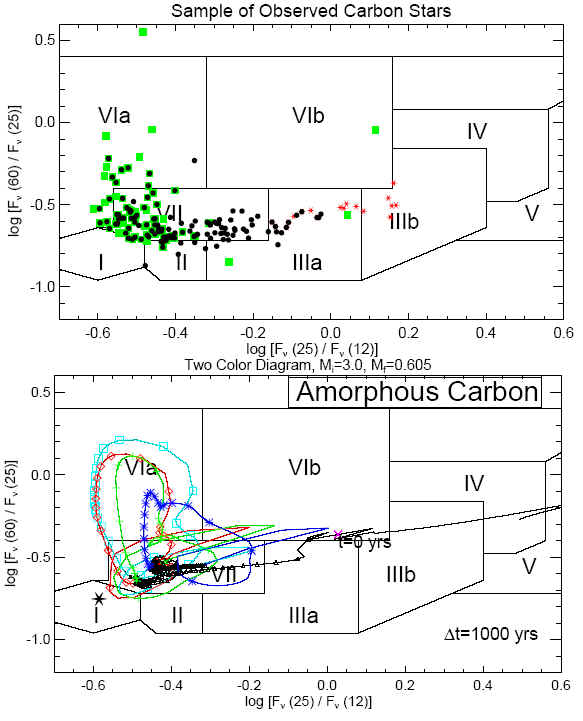
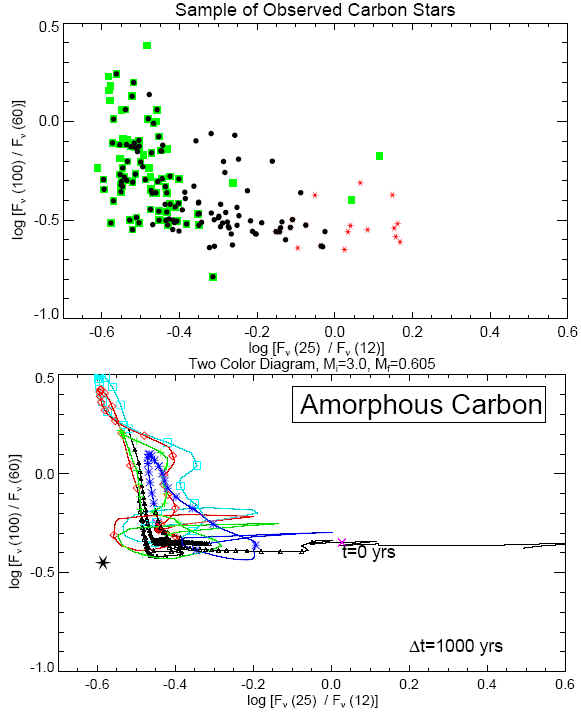
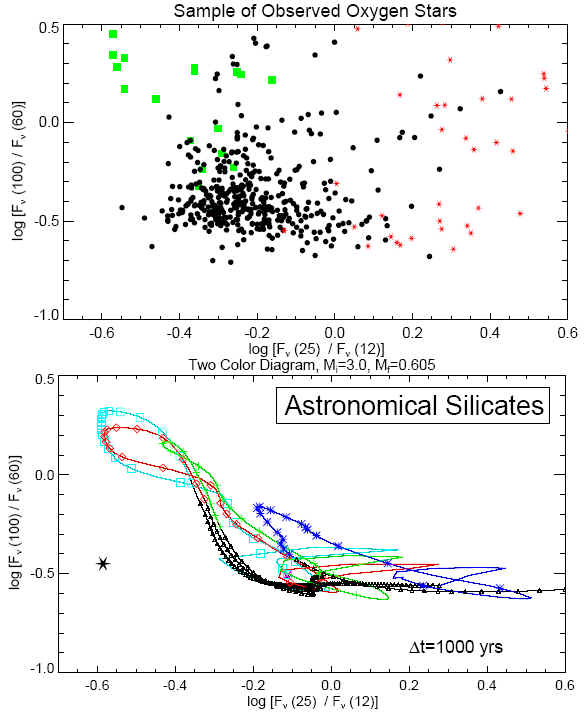
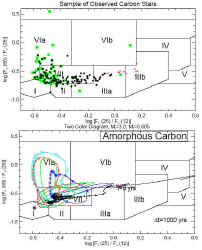
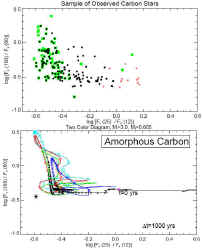
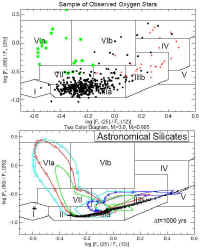
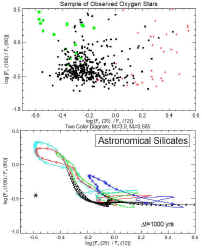
(figure: left --
comparison of model (with the last 4 TPs onlly) with observed carbon
stars (green squares
optical carbon stars; black dots are classical carbon stars with 11.3um feature; red
asterisks are extreme
carbon stars) in IRAS [12-25]-[25-60] diagram; middle left
-- same as left but in IRAS [25-60]-[60-100] diagram; middle right -- same
as left but for M stars (green
squares are M stars with 60um excess; black
dots are M stars with
silicate emission; red asterisks are M stars with silicate absorption) in IRAS
[12-25]-[25-60] diagram; right -- same as middle left but in IRAS
[25-60]-[60-100] diagram. The big black star represents black body
position with T=3000K in all plots.)
    |
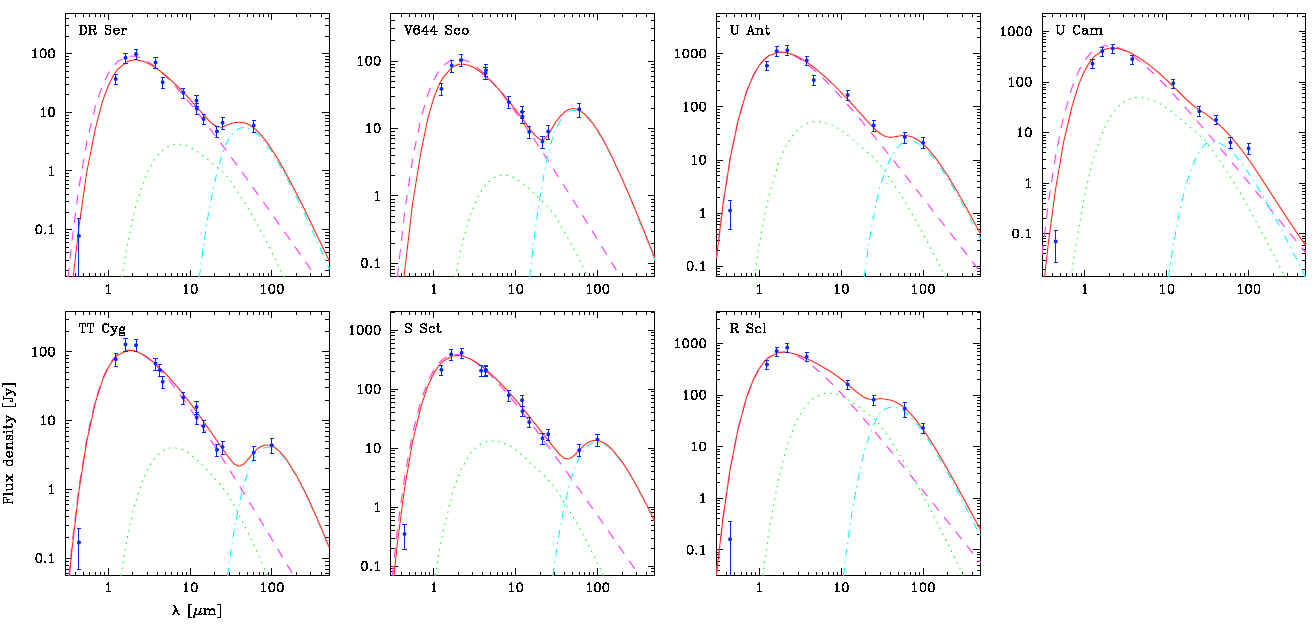
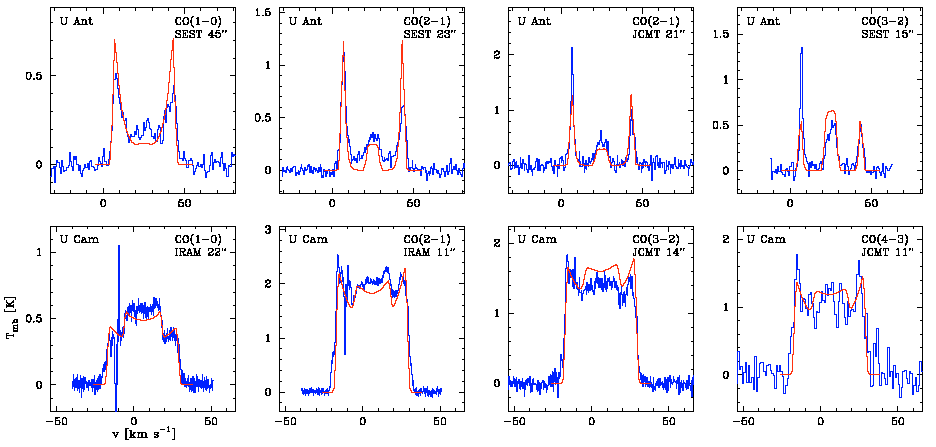
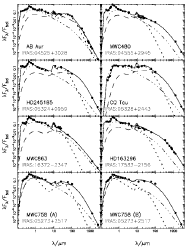
| Detached shell model fitting to several
stars was successful in both IR SED and millimeter spectra. Here are
several examples. The density enhanced shell was thought to be produced
by episodic increase of mass loss rate.
(from Schoier et al., 2005A&A...436..633S)
(figure: left -- SED
fitting; right -- millimeter CO line fitting.)
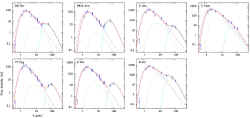  |
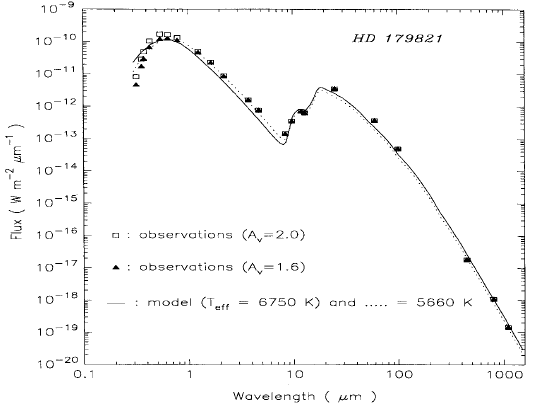
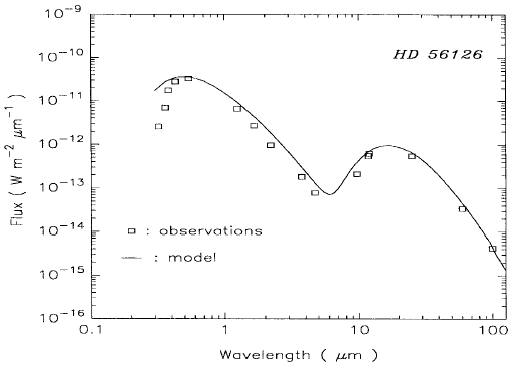
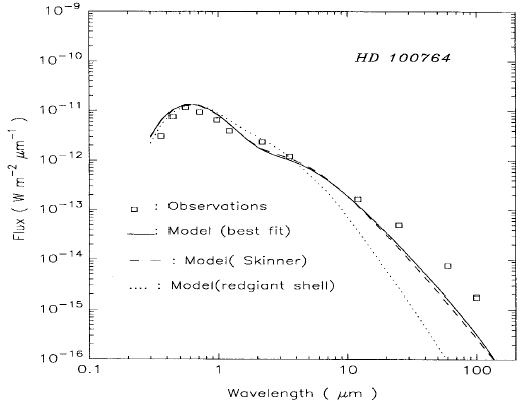
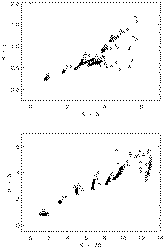
| Other examples of detached shell SED fitting were shown by Surendiranath et al., 2001, ApSS, 281, 751.
(figure: individual examples of SED
fitting)
  |
| |
|
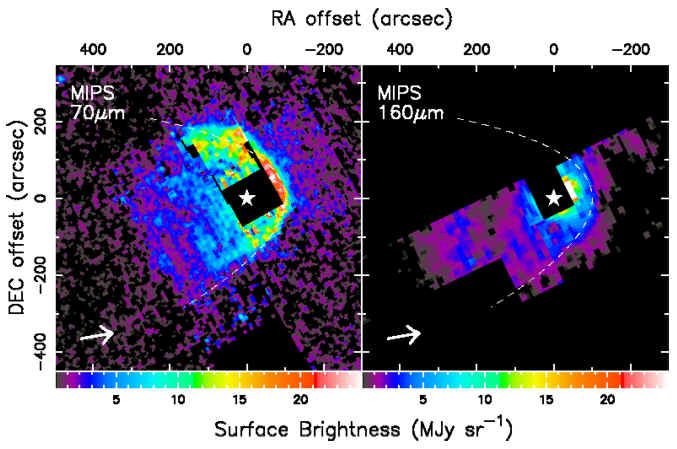
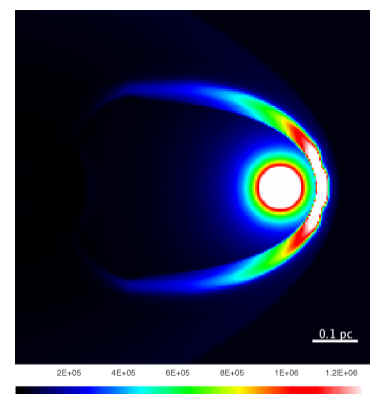
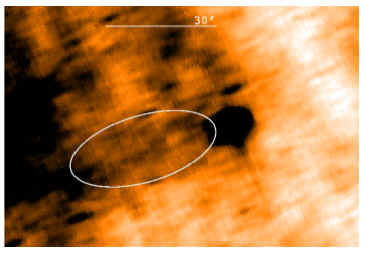
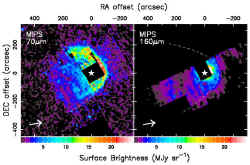
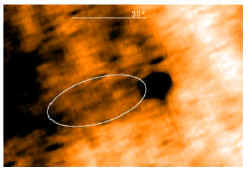
| ISM-interaction
shell
| Spitzer image showed a bow shock shell about the Mira variable star R
Hya. It was believed to be formed by the motion of the AGB star through
ISM. A evidance of tail in the IRAS 60um image was shown too. Therefore,
detached shell may not always be formed by central
star. (from Wareing et al., 2006MNRAS.372L..63W
)
(figure: left --
Spitzer image of the bow shock shell; middle --
hydrodynamical model results of an AGB star moving through ISM; right -- IRAS 60um image showing the tail.)
   |
|
| Scattering
| Monte Carlo simulation of anisotropic dust
scattering in optical wavelengths for CW Leo showed that the
dominant dust grain size is > 0.1 um.
The dust density profile drops steeper than r-2, which demonstrate
an increase of mass loss rate in the past. The some discrepancies were
encountered between observations and model results. (from Lunttila and
Juvela, 2007A&A...470..259L) |
| Radiative transfer in clumpy environments:
absorption and scattering
by dust. (from Hegmann & Kegel, 2003MNRAS.342..453H) |
|
|