|
CIT 6 -- an SR variable (= IRAS 10131+3049, AFGL 1403, IRC +30219, RW
LMi SIMBAD
entry )
Basic parameters:
Period = 641 days (optical, NIR, stellar, amp=~2
mag) (Alksnis, 1995BaltA...4...79A)
Distance = ~400 pc (from L-P relation, Cohen, 1980ApJ...238L..81C
)
Liminosity = 10^4 Lsun (estimated? Schmidt et al., 2002ApJ...576..429S)
Mass = ~ 3 Msun (estimated? Schmidt et al., 2002ApJ...576..429S)
R* = ~ 800 Rsun (estimated? Schmidt et al., 2002ApJ...576..429S)
Mass loss rate = ~ 2 x 10^-6 Msun/yr
(estimated? Schmidt et al., 2002ApJ...576..429S)
V_LSR = -1.0 km/s (Lindqvist et al., 2000A&A...361.1036L)
Vexp = 17.0 km/s
(Lindqvist et al., 2000A&A...361.1036L)
Mm Line Observations
- (Knapp et al., 1979ApJ...233..140K)
Facts: They observed CO 1-0 line at five epochs spanning 17 months but found not variation. 13CO 1-0 was not confirmed.
- (Henkel et al., 1985A&A...147..143H)
Facts: Multiple transitions of several molecules were observed in IRC +10216 and CIT 6. CS 2-1 and 3-2 are surely detected in CIT 6.
- (Guilloteau et al., 1987A&A...176L..24G)
A very strong mm maser: HCN,(0,2^0,0),J=1-0 was discovered in the C star CIT 6. It is very narrow
(FWHM~ 1 km/s).
- (Goldsmith et al., 1988ApJ...333..873G)
Facts: They measured the linear polarization of the HCN (0,2^0,0) J=1-0 maser in CIT 6 and found 20% polarzation at PA = -18 deg, with no significant change across the line profile.
Conclusions: It confirms the maser nature of the line.
- (Lis et al., 1989ApJ...341..823L)
Facts: They observed the polarization of the HCN (0,2^0,0) J=1-0 maser in CIT 6 but failed to detect the circular polarzation at a 3sigma level of 3%, while the previously found linear polarization stays constant for at least one year.
Conclusions: the stimulated emission rate R << magnetic splitting << maser line width.
- (Carlstrom et al., 1990AJ....100..213C)
Facts: They mapped theHCN (0,2^0,0) J=1-0 maser in CIT 6 using the Hat Creek millimeter array.
Conclusions: The size of the maser is <0.45 arcsec (~180AU), together with the strong emission (40 Jy), giving a T_B~44000K.
-
(Fukasaku et al., 1994ApJ...437..410F)
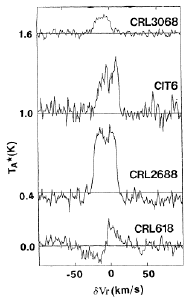
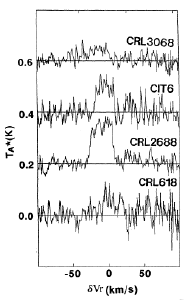
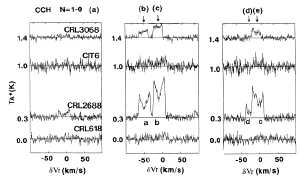
Nobeyama 45m observations of HC3N, HC5N, HC7N, CCH, C4H,
SiS, and HNC molecules towards carbons stars
CRL 618, CRL 2688, CIT 6, and CRL 3068 were reported. The relative abundance of cyanopolynnes, CCH and C4H is
similar as in CW Leo, but that of HNC increases with evolution stages. In CRL2688, HNC comes from a smaller region than SiS.
In CRL 618, HC3N, J=4-3 show P Cygni profile.
(figures: left -- spectra of
HC3N 5-4; middle -- HC5N 17-16; right -- CCH, 1-0
hyperfine components (a,b,c,d,e))
-
(Meixner et al., 1997IAUS..180..359M)
BIMA+NRAO 12m observation of CO,1-0 line in CIT 6 found a core+halo structure. The
parameters were: total flux = 2800+-300 Jy km/s,
Vexp(core) = 13 km/s, Vexp(halo) = 18 km/s, Diameter = 18"(core) or 80"(halo).
-
(Lindqvist et al., 2000A&A...361.1036L)
PdBI mapping of RW LMi (=CIT6) in CN,J=1-0, HCN,J=1-0, HNC,J=1-0, HC3N,J=10-9, HC5N,J=34-33 and SiS,J=5-4 lines show non-spherical CSE around this SRa carbon star. The star has a period of 640 days, L=9700 Lsun, distance of 440 pc, mass loss rate of 6x10^-6
Msun/yr, Vlsr = -1.0 km/s, expansion Vexp =
17.0 km/s. HCN, HNC and SiS showed central peaked distribution, while
CN, HC3N and HC5N showed an incomplete shell with an opening toward east
direction. Elongation toward NW (PA = -25deg) was
seen in HCN and CN maps. SiS and HNC line profile showed strong asymmetry (triangular profile), with much stronger red peak, which is also seen in HCN, CN and HC5N line profiles. HST optical images show two stars separated by 0.25" in the center, but not
sure if they are binary.
- (from Schoier et al., 2002A&A...391..577S)
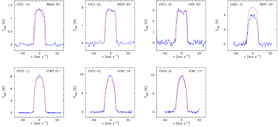
Facts: Detailed modeling of IR SED and multiple transitions of CO of a number carbon stars (including CIT 6) better constrained their mass loss history and other parameters.
Conclusions: Smooth spherical CSE can reproduce the observed CO line profiles well. The IR pumping of CO only plays a minor role to the low transitions (J<4). No drastical mass loss variation is found. CO FIR rotation line is found in 3 stars. They adopted some parameters for CIT 6: Dist = 440 pc, L* = 9700 Lsun, Mlr = 6x10^-6 Msun/yr (assuming X(CO) = 10^-3), Vexp = 17 km/s, Rout(CO) = 1.9x10^17 cm (photodissociation), h=1.4 (dust-grain heating parameter).
(figs: CO lines and fitting.)
- (Zhang, Kwok and Dinh-V-Trung, 2009ApJ...691.1660Z )
Facts: They surveyed 131-160 GHz, 219-244 GHz, and 252-268 GHz ranges of CIT 6 using ARO SMT 10m telescope, detected 74 lines, with 69 lines from 21 known molecules.
Conclusions: The line ratios are basically the same as IRC +10216; stronger CN and HC3N emission than in IRC +10216; weaker HCN, SiS and C4H emission than in IRC +10216; probably lower dust-to-gas mass ratio than in IRC +10216.
- (Dinh-V-Trung & Lim, 2009ApJ...701..292D)
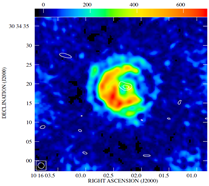
Facts: They did high angular resolution imaging of HC3N J=5-4 in CIT 6, found clumpy asymmetric structures: 1) faint nearly spherical outer shell with a radius of 8"; 2) an inner single spiral shaped structure with radius of 5".
Conclusions: The HC3N is unusually overabundant in CIT 6 and could be produced by shock chemistry in the spiral shocks; the morphology may be the result of binary interaction.
(fig. Intensity map of HC3N 5-4 showing spiral + ring pattern. The white contour is 7mm continuum emission.)
Optical/IR Observations
- (Strecker & Ney, 1974AJ.....79.1410S)
Facts: IR photometry between 0.9 ~ 18 um of 14 CIT objects were obtained and compared with that of NML Cyg, NML Tau, and IRC + 10216.
- (Cohen, 1980ApJ...238L..81C)
Facts: Optical spectroscopic monitoring of CIT 6 between 1977 and 1980 revealed drastical changes. The photosphere and its emission lines appeared in early 1979, but disappeared in late 1979.
Conclusions: The photosphere was vealed by a recent condensation of dust grains.
-
(Zacs, 1997Ap&SS.251..289Z)
Strong C3 absorption bands in blue light were
detected in CIT 6, indicating carbon rich star.
But the spectrum also indicates a F-G type star (or secondary star).
- (Monnier et al., 2000ApJ...545..957M)
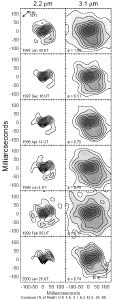
Keck I telescope imaging of CIT 6 at 2.2 and 3.1um at multiple epoches was present. The IR nebular was resolved into two components. The northen component is dominant. A binary model is required to explain the blue band
morphology and the polarization distribution.
(figure: time variation of IR images.)
- (Alksnis, 1995BaltA...4...79A)
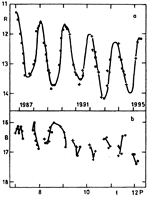
Facts: The monitoring of CIT 6 was continued during 1989-1995 in IR, red, visual, blue and UV bands. New data confirmed that the IR and red bands show long period variations whilst the blue and UV bands show different behaviors.
Conclusions: The period is 628 day.
(fig.: light curve of red (upper) and blue (lower) bands.)
-
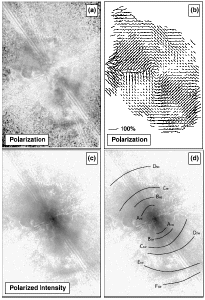
(Schmidt et al., 2002ApJ...576..429S)
Multi-epoch HST NICMOS imaging and imaging polarimetry of CIT 6 and decades of
ground based spectroscopy, spectropolarimetry and broadband
polarimetry observations were used to explore the structure,
polarization and temporal variability of the star. Two
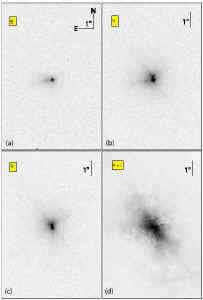
components were found in R-band image.
IR nebula is ~10 times larger than the optical component and is highly polarized (P= ~ 20%, dust scattering). The emission in wavelengths longer than 6000A are varying with time at the pulsation period of ~640 days, while bluer nearly featureless continuum emission does not varying significantly. The red emission could be from a C-star, while the blue emission could be from a main sequence star that is at least 40 AU away from the C-star. The
strongest polarization occurs in the bipolar regions. A fan like structure was found in the B-band image
along the right angle from the bipolar lobes. Faint multiple arc-like structures were identified in the bipolar
regions.
(figure: left -- a)-d) are B, V, R
and PxI images; right -- polarization maps)
Chemistry
- (Kahane et al., 1992A&A...256..235K)
Oxygen isotope puzzle: paper 2
- IRAM 30m telescope line observations of 12CO, 13CO, C17O, C18O during August of 1988.
Tmb = TA* / eta (eta = 0.60 around 115 GHz, 0.45 around 230 GHz)
- Determined isotope ratio:
The terrestrial value of 32S/34S ratio of 22.5 is
used to constrain 12C/13C = 31(+6-5) from C34S/13CS, and further derived
16O/17O =
840(+450-270)
16O/18O > 1270
(C18O line not detected)
17O/18O >
1.1 (C18O line not detected)
|
![]()