SIMBAD: IRC
+10216
Table of
contents:
Basic
facts:
(go to top)
It's a Mira variable.
Pulsation
period: 1.71 yr (Cernicharo
et al., 2000, A&AS 142, 181)
or
~650 days (luminosity period from Le Bertre 1992A&AS...94..377L).
Luminosity: ~ 10,000
Lsun (Groenewegen
& Ludwig 1998A&A...339..489G)
or
5200~13000 Lsun (Menshchikov et al., 2001A&A...368..497M)
Effective
temperature: 2500~2800 K (Menshchikov et al., 2001A&A...368..497M)
Stellar
radius: 390~500 Rsun (Menshchikov et al., 2001A&A...368..497M)
Main
sequency mass: 3-4 Msun (Guelin et al., 1995A&A...297..183G; Forestini et
al., 1997A&A...317..883F)
Mass loss
rate: ~ 1.5x10⁻⁵ Msun/yr (Groenewegen et al., 1998A&A...338..491G)
or
2x10⁻⁵ Msun/yr (Ivezic & Elitzur 1996MNRAS.279.1019I;
Danchi et al. 1994AJ....107.1469D)
or
3x10⁻⁵ Msun/yr (Truong-Bach et al., 1991A&A...249..435T)
or
3.25x10⁻⁵ Msun/yr (Crosas & Menten, 1997ApJ...483..913C).
Outflow
velocity:
14.5 km/s (Cernicharo et al., 2000A&AS..142..181C)
Angular
size: ~ 200
arcsec (CO line emission size, Fong et al., 2006ApJ...652.1626F)
or
~ 2.6 degree (dust grains extent, Menshchikov et al., 2001A&A...368..497M)
Distance:
110-135 pc (Groenewegen et al., 1998A&A...338..491G)
or
150 pc
(Crosas & Menten, 1997ApJ...483..913C)
Number of
Mol.
species detected: ~50
Molecular rotational temperature in the circumstellar cenvelop (CSE) :
10-50 K
Chemical
processes:
 |
3-body processes in the hot and dense
atmosphere; |
 |
surface reactions in the dust condensition
region; |
 | gas phase neutral-neutral or ion-molecule
reactions in the CSE; |
 |
photodissociation in the envelope outer skin. |

Imaging observations:
(go to top)
 |
Optical/infrared imaging
-
HST imaging with F814W filter (centered at 0.8269um)
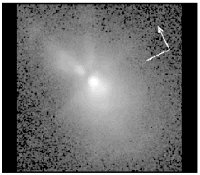
show a compact bipolar reflection nebula in the central region of CW
Leo, which resemble the bipolar structure found in PPN Cygnus Egg
Nebula, CRL 2688. This indicates that CW Leo is evolving towards PPN.
(from Skinner et al., 1998MNRAS.300L..29S)
(Figure: HST image of the bipolar
reflection nebula, 10"x10", arrow to north, the other line to
east)
-
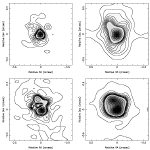
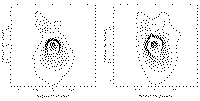
Bi-spectrum interferometry observation in NIR (K: 2.2um and
L:3.4um) towards IRC +10216 revealed non-spherical structure on 0.1" scale and show variation between the two epoches of
1989 and 1997. HST images at 0.79 and 1.06um show a filament towards NE 5deg and a
dark lane perpendicular to it.(from Haniff & Buscher,
1998A&A...334L...5H)
(figures: left
-- NIR images showing temporal evolution: left column is narrow K band
and the right column is narrow L band, top in 1989 May and 1997 March
(contour levels: 1, 2, 3, 4, 5, 6, 7, 8, 9, 10, 20, 30, 40, 50, 60, 70,
80, 90%); right
-- HST image at 0.79um (left) and 1.06um (right) showing wavelength
depentence (contour levels set as the same as the NIR images).)
 _ _
-
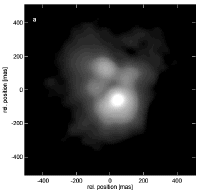
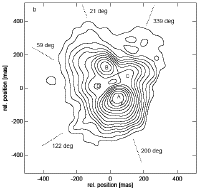
Speckle masking observation at K' band (2.17um) showed
4 components in the central 0.21" radius
(Apr. 3, 1996). They argued that localized ejection from large convective granules in the
photosphere is possible cause of these components (granule size can be comparable as
the stellar radius). (from Weigelt et al.,1998A&A...333L..51W)
(figures: left
-- the K' band image; right
-- the contour plot of the same map but with different components
marked.)
 _ _
-
B and V band imaging
was performed using CFHT. They found some roughly spherical
but incomplete arcs in the images of IRC +10216. The arcs have azimuthal
extent of 30-90 degrees w.r.t. the center star. Separation of arcs are
iregularly between 5-20 arcsec, corresponding to a time interval of
200-800 years. The dust scattering structures roughly
agree with the molecular peaks
of MgNC and C4H maps. (from Mauron and Huggins, 1999A&A...349..203M)
(V (left panel)
and B (right panel) images of IRC+10216. The field is
223"X223". North is at the top, East to the left. Composite B+V
image of IRC+10216, shown with a regular transfer function (left) and with
an average radial profile subtracted (right) to enhance the contrast. The
field is 131"x131". North is at the top, East to the
left.Comparison of the dust and gas shells in IRC+10216. The crosses show
the location of emission peaks in the molecules CN, HNC, and HC3N
(Lucas
& Guélin 1999), superposed on a filled contour version of Fig. 3.
The axes are labeled in arcseconds from the center.)
![[FIGURE]](img21_small.gif) ![[FIGURE]](img43_small.gif) ![[FIGURE]](img60_small.gif)
-
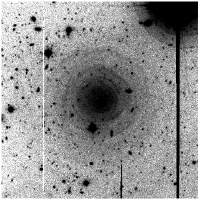
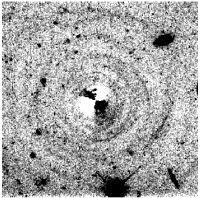
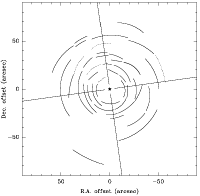
CFHT V band and HST V band images of CW Leo revealed multi-arcs in its CSE. The
arc-like shells are geometrically thin (angular
thickness of 0.5"-3"). The shell spacing is irregular
(5"-20"), corresponding to timescales of 200-800
yr, although shorter spacing of 1" (40 yr) were also seen.
The shell/intershell density contrast is typically
~3. (from Mauron & Huggins, 2000A&A...359..707M)
(Figure: left
-- CFHT V-band image 223"x223"; middle
-- HST V-band image 74.5"x74.5" with a smooth background
subtracted and rotated 26 deg counterclockwise; right
-- overview of the multiple shells found in previous two maps.)
 _ _ _ _
-
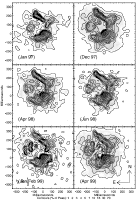
Keck I telescope observations of IRC +10216 in K band had
been performed between 1997 Jan 29 and 1999 Apr 25 (~ 638 days).
The technique of non- and partially redundant aperture-masking interferometry was
used. Complex structures and temporal changes were reported within a radius of 0.5" (~20
R*). A dark lane with position angle (PA) of 120 deg (N to E) is suggested
to be a optically thick disk or torus, which might be related to the
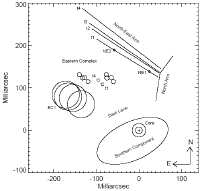
well-known bipolarity at the PA of 20 deg. Proper
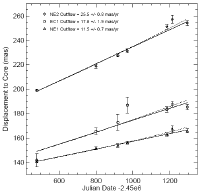
motion of clumps are found (see in fig. 1 below). The time variation of distances to the
brightest compact point show outward acceleration of angular velocity. (NOTE:
Two limitations of the interferometrically reconstructed maps
should be mentioned. First, the absolute photometry, or
surface brightness scale in the maps, is difficult to
calibrate with any great accuracy. For this reason,
images shown have fluxes scaled relative to the peak
intensity in each map, and discussion will refer to
these relative fluxes. Second, the closure phase
method does not deliver absolute positional information,
and the center of each map has been chosen to be the
location of the brightest pixel.) (from Tuthill et
al., 2000ApJ...543..284T)
(Figures from left to rigth: (1) K band images of small scale structures
in different epochs, north up, east left; (2) illustration of the proper motion of
major components; (3) time variation of relative positions of several major components)
 _ _ _ _
-
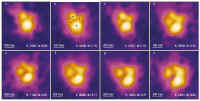
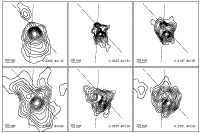
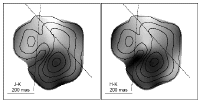
The NIR (JHK) emission of CW Leo was monitered by bispectrum speckle interferometry using the SAO 6m telescope during 1999 to
2001. The total sequence of images span from 1995 to 2001 and show dynamical evolution of different components.
Four major components within 0.2" radius can be identified from the K plates. Temporal variation of brightness images
and J-K, H-K color images indicate that the brightest southern component A is
the bluest region and so a low-density scattering hole. The nothern
secondly brightest compolent B weakened from 1998 to 2001 and was argued to be the possible position of the
central star (weakening explained as obscuration by newly produced dust).
(from Weigelt et al., 2002A&A...392..131W)
(figures: 1)
K-band images at different epoches from left to right and from top to
bottom; 2)
J, H, K band images (left to right) in March 2001; 3)
comparison of J, H, K maps obtained at two epoches April 1996 (top) and
March 2001 (bottom); 4) J-K
and K-H color maps in which light is red and dark is blue.)
 _ _ _ _ _ _
-
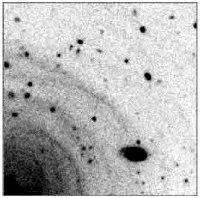
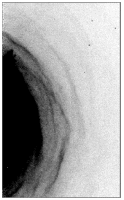
The prototype of globules found in Helix nebula was not found in the archival HST image of NGC 7027 and the archival VLT image of
IRC +10216, which means the Helix globules are not from the photosphere
of the star. (from Huggins & Mauron, 2002A&A...393..273H)
(Figures: left
-- VLT V-band image 51.2"x51.2" with the star at the
left-bottom corner; right
-- HST Halpha image of NGC 7027 with 17.7"x29.0".)
 _ _
-
UBV scattering maps were obtained by HST for CW Leo. No pattern was seen.
(from Mauron et al., 2003A&A...401..985M)
-
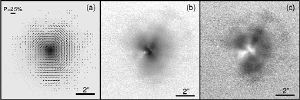
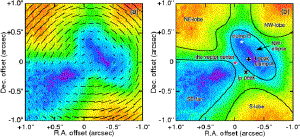
H band (1.573um, +-0.02um) polarimetric imaging
observations of IRC +10216 were carried out using CIAO at Subaru on 2003
Juanuary 3. The FWHM spatial resolution is 0.25 arcsec. Linear polarization
maps show non-spherical structures such as fan,
ellipse, bipolar, radial,
arc structures. The linear polarization directions constrain the position of
the central star to be off by (+0.25",-0.065") from the position of the total intensity
peak.(from Murakawa et al., 2005A&A...436..601M)
(figures from left to rigth: (1) total IR
intensity map with linear polarization vectors overlapped; (2) linearly polarized intensity
map; (3) linear polarization degree distribution map; (4) colorized close-up of
polarization degree distribution map with polarization vectors overlapped;
(5) illustration
of star position, different map centers and different structures)
-
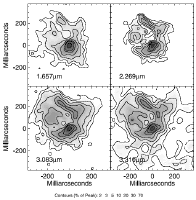
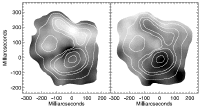
Multi-wavelength interferometric IR images
(H,K,L bands) of CW Leo were obtained with Keck I during
1997 December and 1998
April. The images were found to be wavelength
dependent. They revised the conclusion that the brightest component A is the star
itself. (from Tuthill et al., 2005ApJ...624..352T)
(Figures: left
-- maps showing wavelength dependence; right
-- H-K and K-L color maps in which light is red and dark is blue.)
 _ _
-
Near IR small scale imaging (NACO adaptive optics system of ESO/VLT Yepun telescope) and V-band large scale imaging (FORS1 focal reducer of ESO/VLT-Antu telescope) for IRC +10216. They analysed and
compared the large and small scale images and concluded that
-
It's difficult the connect the large and small scale
structures together under any known AGB star model. The morphology and time
scales of the structures do not agree to episodic mass loss model, fast and
slow wind interaction model, and cool magnetic spots model, and cannot be
easily connected to stellar evolution and stellar variability.
-
On small scale (sub-arcsec), they re-discovered the structures
found 4 years ago by others: 4 clumps with some kind of relative motion, but
the motion of different clumps do not agree to uniform
acceleration.
-
On large scale (up to a few arcmin), the quasi-spherical
but a little irregular incomplete shells are resolved into smaller shells
with uniform thickness of about 1~2", regardless of the distance from
the center.
-
They speculated that the chemical processes in the dense
shells might be different from that in a uniform circumstellar shell. (from
Leao et al. 2006A&A...455..187L)
(figures from left to rigth: (1) small scale J, H, K, L
images; (2) high spatial frequecy pass filtered image (via Fourier transform
and reconstruction); (3) large scale V-band image; (4) large scale V-band image with CSE
halo,
background/foreground stars and galaxies removed)
![img27[1].gif (245458 字节)](img27[1]_small.gif) ![img30[1].gif (32567 字节)](img30[1]_small.gif)
![img35[1].gif (287760 字节)](img35[1]_small.gif) ![img37[1].gif (322012 字节)](img37[1]_small.gif)
-
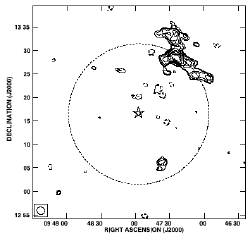
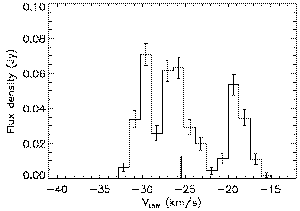
Interferometric HI imaging of IRC+10216 and several other
AGB stars. They detected a
arc like HI emisstion region 14-18 arcmin from the
center star. The spectral line profile of H I emission is also different
from the expected rectangualr profile. (from Matthews and Reid, 2007AJ....133.2291M)
(figure: left
-- total intensity H I map; right
-- spatially integrated H I spectral (vertical
line show systemic velocity of the star).)
-
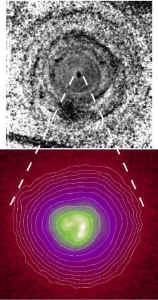
They published the multiwavelength NIR images of CW Leo
derived using NACO adaptive optics system of ESO/VLT Yepun telescope.
They discussed time evolution of the maps.
(from Menut et al., 2007MNRAS.376L...6M)
(fig:)
|
 |
Radio/millimeter mapping
- Following is a list of mapped molecules. Their maps
can be found in the "Molecular
line observations" section in this page below. Only summary or
miscellaneous papers on mapping results are presented in this section.
- CO
- MgNC
- C3H
- C4H
- CN
- H13CN
- SiCC
- CS
- SiS
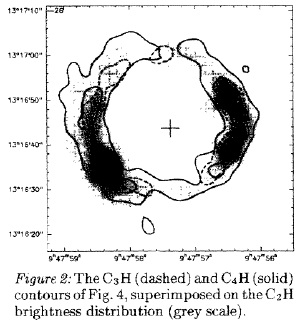
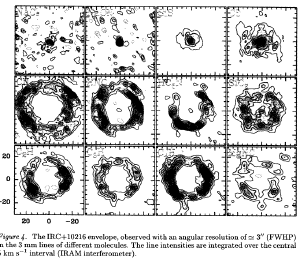
- Molecular maps of IRC +10216 by PdBI show that some molecules show hollow intensity distribution,
while other molecules show the
strongest intensity in the central compnent. The shown molecules in the
second map below are (left to right, top to bottom): NaCl, NaCN, SiS, CS, CN, HNC, HC3N, SiCC, C2H, C3H, C4H, MgNC.
The
ring like map also show some kind of deviation from spherical symmetry.
(from Guelin et al., 1996IAUS..170..359G)
(maps from left to right: (1) map of C3H; (2) maps
of other shell and central molecules)
 _ _
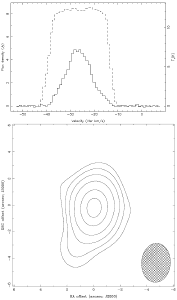
- They present part of the 345
GHz band imaging spectral survey of CW Leo.
They find a group of narrow lines with linewidth of ~4 km/s, one-third of the expansion velocity of
the outer envelope. 25 lines are found to be narrower than 7 km/s. Many of them are from the vibrationally
excited state of stable molecules. The map of SiS
v=1, J=19-18 showes an extended structure
towards southeast. CS has a high abundance of CS/H2 >= 9.3x10^-6 in a conpact region (< 7
R* or 4.5x10^14cm), which is more consistent with shock
chemistry than LTE chemistry. (from Patel et al., 2008arXiv0811.2142P)
(figs: upper -- SiS, v=0 (broken line) and v=1 (solid line)
J=19-18 line profiles, lower -- SiS v=1, J=19-18 line integrated flux map.)
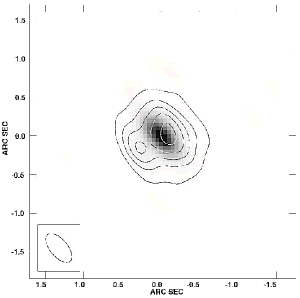
- The first results form the eSMA showes two components on the HCN J=3-2, v=(0,1,0)
map of CW Leo.
(from Bottinelli et al., 2008SPIE.7012E..11B)
(fig: the HCN J=3-2, v=(0,1,0) map of CW
Leo obstained by eSMA on 2008 April 14. The grey scale is continuum
map.)
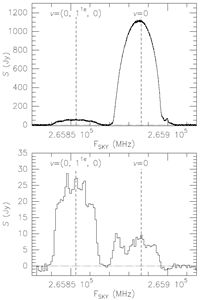
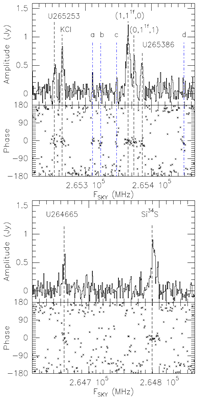
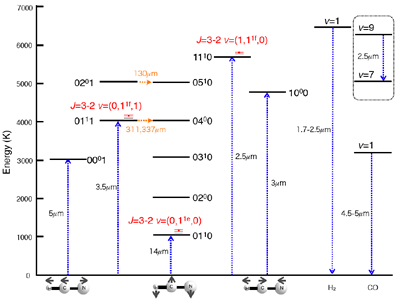
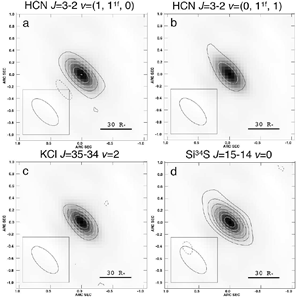
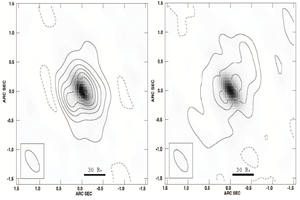
- Very high spatial resolution observations (0.22"x0.46") by eSMA revealed two components in the maps made in the HCN J=3-2 lines in the v=0 and (0,1^1e,0) states. The two components are different from the stellar position that is traced by continuum maximum and other high excitation line maps (that of HCN 3-2 (1,1^1f,0), HCN 3-2 (0,1^1f,0), KCl 35-34 v=2 and Si34S 15-14 v=0). Most emission of the two HCN lines are found within a radius of 1" (~ 60 R*). For the two components in the map of v=0 line: P.A. of 130 deg, symmetrically 200mas from central star on both sides; for the two components in the map of v=(0,1^1e,0) line: P.A. = 115 deg, the northwest component is 90 mas while the southeast component is 300mas from the central star. Tk= a few 100K at 200mas radius (Keady et al., 1998 model).They proposed two substructures for the inner most region of the star: region I -- showed by high excitation lines, < 15R*; region II -- a partial shell structure traced by the two HCN masers, 11R* ~ 22R*. But the radius of these structures are slightly larger than the IR linear polarization minima found by Murakawa et al. (2005). Another interesting point is that the expansion velosity of Si34S is the largest (16 km/s), while its spatial size is smaller than that of the two HCN masers, which seems to be at odd with the wind acceleration model. (from Shinnaga et al., 2009arXiv0904.0280S)
(Figs. upper left -- HCN lines compared between eSMA and JCMT; upper middle -- all detected narrow lines; upper right -- energy levels of HCN, CO and H2 and relevant transitions; lower left -- maps of high excitation lines overlayed on continuum map; lower middle -- maps of HCN 3-2 of (0,1^1e,0) and v=0 states (left & right); lower right -- channel maps of the HCN 3-2 (0,1^1e,0) line.)
|
| |
|

Spectral
line surveys
(go to top)
-
OSO 3-4 mm (72.2-91.1 GHz) survey
(by Johansson et al., 1984A&A...130..227J)
(click here to (un)fold contents)
 | Sensitivity is 0.1 K, resolution is 1 MHz. Beam
size is 47" at 80 GHz, mainbeam efficiency is 0.58+-0.05, aperture
efficiency is 0.44+-0.05.
|
 | Detected 45 lines from 12 molecules: CO, CS, SiO, SiS, CCH, HCN, HNC, C3N, HC3N, HC5N, C4H,
CH3CN.
|
 | First detection of Si34S.
|
 | Number of detected lines in IRC+10216 is much
smaller than in Orion KL molecular cloud, perhaps due to the lack of
excitation conditions, instead of the lack of molecules.
|
JCMT 0.8-1.3 mm (224.2-233.9,258.2-267.9,339.6-364.6 GHz) suervey
(by Avery et al., 1992ApJS...83..363A)
(click to (un)fold
contents)
 | The surveyed 224.2-233.9,
258.2-267.9 (1988, April 4-7, Nov. 26-28), and 339.6-364.6 (1989, March
4-12, October 20-22) GHz ranges. |
 |
Formulas used to derive Tmb: TA* = TA' / eta_r / eta_rss; Tmb
= TA* / eta_mb / eta_c, where eta_c is the efficiency with which the
source couples to the main beam of JCMT. Double sideband. Sensitivity of
0.3 K. |
 |
Used parameters of JCMT: |
 |
eta_fss
= 0.8 (230GHz), 0.7 (345GHz) (mentioned but not used in the paper); |
 |
eta_mb
= 0.65 (230GHz), 0.5 (345GHz) (by measurements of Jupiter -size 30"-
and Venus -size 35"-); |
 |
beam width
(FWHM) = 21" (230GHz), 16" (345GHz). |
 | They detected 54
lines, including 46 lines of 11 molecules or
isotopomers: CN, CO, 29SiS, SiS, SiCC, H13CN, 29SiO, HCN, C4H,
C2H, CS and another 8 unidentified lines. |
 |
SiCC:
Adopted mol. parameters: permenent electric dipole moment mua = 2.393 D
(from Suenram et al., 1989ApJ...342L.103S) |
 |
Rotation diagram analysis shows
that transitions within Ka ladders is lower than that between Ka ladders
(with the same J), with the former excited by radiation and the latter
by collision. Therefore, Tkin = 180+-40 K and
145 K are found from inter-Ka-ladders transitions, Trot = 14+-3 K
and 60+-15 K are found
from intra-Ka-ladders transitions. But the high Tkin is inconsistent
with the kinematic temperature of gas in the envelope of IRC+10216. The
possible cause of the high temperature between Ka-ladders might be IR
pumping by 63 um photons through the antisymmetric nu3 mode.
Column density N = 9.5x1014 cm-2
(for Trot = 14 K gas) and 1.9x1015 cm-2
for Trot = 60 K gas). The sum of the two is one order of
magnitude larger than the results from Thaddeus et al., 1984ApJ...283L..45T,
and somewhat larger than the value of 2x1015 cm-2
from Cernicharo et al., 1987A&A...181L...9C. |
 | C4H: Adopted
mol. parameters: permenent electric dipole moment mua
= 0.9 D, line strength S = (Ju2-Omegau2)/Ju
with Omega = 1/2 for the 2Sigma state. Partition
function Q = (2s+1)KT/hB = 2KT/hB for the 2Sigma
linear molecule (S=1/2), with B = 4759 MHz. |
 | Rotation diagram analysis
gives: Tex = 48+-4 K, N =
5.6x1015 cm-2
(using size of 25" from Cernicharo et al., 1987A&A...181L...9C) |
 | C2H:
Tex = 20+-2 K, N = 5.4x1015 cm-2 (using
source diameter of 43" from Truoung-Bach et al., 1987A&A...176..285T
and Biejing and Nguyen-Q-Rieu 1988ApJ...329L.107B) |
 | CN:
Adopted mol. parameters: Q = 2kT/hB + 0.66
for low Tex. |
 | Tex = 7.6+-2 K, N
= 7.6x1014 cm-2 (using source diameter of
77" from Truoung-Bach et al., 1987A&A...176..285T
and )) |
 | HCN, SiS, SiO: not optically thin or no enough data
for rotation diagram analysis. Possible effect of variation with
infrared. |
 | The density of mol. lines in
the surveyed range is 5 lines/GHz. The integrated line intensity is
comparable to the detected broad band flux density at 850 um (354+-15GHz
broad band). |
CSO 0.8-0.9 mm (330.2-358.1 GHz)
survey (Groesbeck et al., 1994ApJS...94..147G)
(click to (un)fold
contents)
 |
Average sensitivity is 95 mK. Spectral resolution is
1 MHz. Used a deconvolution method to reconstruct single side band
spectra from their double side band observations. Mainbeam efficiency
eta_mb = 0.6 for point source and 0.76 for extended sources. Beam size
is 20". Pointing error is 5".
|
 |
The DSB observations were perform with half band
width overlap between adjacent frequency band to help regonize any lines
from image side band. Then a CLEAN algorithm was implimented to
reconstruct the SSB spectra.
|
 |
They detected 56 lines,
54 of them are assigned to 8 molecules (18 isotopomers), with only 2
unidentified lines.
Detected molecules: CN, CS, C2H, SiCC,
HCN, SiS, SiO, CO.
|
 |
They concluded that significant correction for line
flux is necessary for broadband flux measurement of IRC+10216 longer
than 750 um.
|
 |
CO:
-- 13CO column density:
1) Take the optically think and extended 12CO
line brightness temperature (33-35 K) as
the excitation of 13CO, then determine the column density of 13CO
from J=3-2 line to be 4.0 x 1016 cm-2.
2) They use 13CO J=3-2 and two
other lines from literature (2-1, 1-0) to do rotational diagram analysis
and determine the 13CO excitation temperature and column
density to be 17 K and 5.0 x 1016 cm-2.
-- 12CO column density:
Because 12C/13C
= 44 from literature, so 12CO column desity is 2.0 x 1018 cm-2.
Similar analysis were done for CS, SiO, HCN, SiCC, CN, CCH
|
 |
Vibrationally excited state transitions of HCN and
SiS tend to show triangular line profile, indicating peculiar excitation
of these lines.
|
A smaller survey observations of 10
lines of 13CO, SiO,
SO, HCN, HNC, HC3N, SiS and CS was performed
towards 47 AGB stars, including CW Leo. (from Bujarrabal et al., 1994A&A...285..247B)
Nobeyama45M 6-10 mm (28-50 GHz) survey
(by Kawaguchi et al., 1995PASJ...47..853K) (click to (un)fold
contents)
 |
Sensitivity is < 10 mK. Beam size is
34.9"+-1.1" at 49 GHz and 41.5"+-1.1" at 43 GHz.
|
 |
Totally detected 188 lines,
with 150 assigned to 22 molecules and their
isotopic variants. 38 unidentified lines.
Detected molecules: HC3N, HC5N, HC7N, HC9N, C3H,
C4H, C5H, C6H, C3N, HCCN, CS, HCS, CCS, C3S, SiCC, C4Si, SiO, SiS,
c-C3H2, H2CCCC, MgNC, MgCN, CH3CN.
|
 |
excitation temperatures and column densities were
determined by considering opacity effect (not optically think
assumption).
|
Molecular line ratio study of 61 AGB stars. Observed CO,J=1-0,
HCN,J=1-0, SiO,J=2-1,
SO(2_2-1_1) and (3_2-2_1), SiS,J=5-4, CS,J=2-1 of CW Leo using OSO and SEST.
(from Olofsson et al., 1998A&A...329.1059O)
IRAM30M 1.7-2.3mm (129-172.5GHz) survey
(by Cernicharo
et al., 2000A&AS..142..181C)
(click to (un)fold
contents)
 |
Observations between 1986 and 1997 (11 years duration).
Beam width (FWHM): 14.5"-17"
spectral resolution: 1 MHz (~ 2 km/s at 2 mm) |
 |
They detected 380 lines between 129.0-172.5 GHz,
identified
for 30 molecules/radicals. (Half of the molecules in IRC+10216 are detected in
this work.)
63 lines remain unidentified. |
 |
The 30 detected molecules: AlF CH3CN
CP CS C2S C3H C3H2
C3N C3S C4H C5H
C6H ClAl ClK ClNa HCCN HC3N
HC5N H2C4 H2S
MgNC NaCN PN SiC
SiC2 SiC3 SiN
SiO SiS c-C3H (molecules
in pink color is first detected in this
work) |
 |
Other 23 species in IRC +10216 not in
this 2mm survey: NH3 CN CO C2 C3 C4Si
C5 H2C6 C7H C8H HC9N
SiH4 HCN C2H H2C3 C5N HC7N
HNC HCCH HCO+ H2CCH2 CH4 MgCN |
 |
Vexp -- Envelope
expansion velocity: 14.5 +- 0.2 km/s (by profile fitting to strong lines,
the same for all lines)
Vsys -- Local Standar Reference velocity (LSR): -26.5 +- 0.3 km/s
(by profile fitting to strong lines, the same for all lines) |
 |
No time
variation is found during the 11 year observations. |
 |
Three kinds of spatial distribution of molecules:
-- Confined to inner envelope with radius
< 6": Metal-bearing species like NaCl, AlCl, KCl and AlF
(Cernicharo & Guelin, 1987A&A...183L..10C),
SiO, SiS.
-- Confined to a thin hollow shell of
radius ~ 15": Carbon chains, SiC, SiCC, MgNC (e.g., Guelin
et al., 1993A&A...280L..19G)
-- Through out the whole envelope:
CO, HCN |
 |
Abundances
of species (rotation diagram analysis for species in the
optically thin shell only)
-- Oxygen-bearing compounds: just a few, e.g., CO, SiO, HCO+
(most O atoms locked in CO and SiO)
-- Carbon chains and radicals: large abundance of unsaturated
species. E.g., C4H show many strong lines.
-- Cyclic compounds: three detected: c-C3H, c-C3H2,
c-SiC3.
-- Silicon-bearing species: SiO, SiS (inner envelope), SiC, SiC2,
SiC3, SiC4 (in shell)
-- Metal-bearing species: NaCl, KCl, AlCl, AlF; MgNC, MgCN.
-- Phosphorus compounds: CP, PN |
 |
Isotopic
species (low abundance of 15N indicates material
processed by CNO cycle in this star; isotopic ratios calculated from
line ratio with a correction of frequency factor nu-2, cf.
Kahane et al., 1988A&A...190..167K,1992A&A...256..235K)
-- Chlorine: 35Cl/37Cl
= 3.1+-0.6 (solar: 3.1) using NaCl, KCl and AlCl lines.
-- Magnesium: 24Mg:25Mg:26Mg
= 78:11+-1:11+-1 (solar: 79.0:10.0:11.0) using MgNC lines.
-- Aluminium: (26AlF J=7-6 line not confirmed yet,
non-detection of J=5-4, 4-3 lines).
-- Silicon: 28Si/29Si
= 15.4+-1.1 (solar: 19.6) using SiS and SiC2 lines. (opacity
effect with tau=0.5)
28Si/30Si = 20.3+-2.0
(solar: 29.8) using SiS and SiC2 lines. (opacity effect with
tau=0.9)
29Si/30Si =
1.45+-0.13 (solar: 1.52) using SiCC, SiS and SiO lines.
-- Sulfur: 33S/34S
= 0.18+-0.01 (solar: 0.18) using 1 line of CS and 2 lines of SiS lines.
32S/34S = 21.8+-2.6
(solar: 22.5) using 13CS, 29SiS lines.
32S/33S = 62+-8 (solar: 125) using SiS lines. (opacity
effect with tau=1.6)
(note: all SiS lines are of 1/2 intensity as in
Kahane et al., 1988A&A...190..167K.
Why???)
-- Carbon: 12C/13C
= 37+-5 (solar: 89) using SiCC. (opacity effect with tau=0.5)
= 50+-7 (solar: 89) using Si13CC/30SiCC with solar
28Si/30Si=1.52.
= 41+-4 (solar: 89) using Si13CC/29SiCC with solar
28Si/29Si=19.6.
= 46+-6 (solar: 89) using C34S, 28Si13C/30Si12C,
29Si12C/28Si13C with solar
values for Si.
= 45+-3 (solar: 89) average of above.
12C/14C > 5x10⁴
(noisy spectra)
Isotopical fractionation:
-- Equilibrium fractionation
-- Kinetic fractionation (see Wiki)
-- Mass-independent fractionation (see Wiki)
** example: HC3N, C4H, C3N (Kahane et al., 2000A&A...357..669K) |
 |
Weak unidentified
lines may be attributed to low-lying bendint states of C5H,
C6H, NgNC and NaCN, stonger ones to unknown asymmetric
species or species with non-zero electronic angular momentum. |
SEST
& OSO 2mm & 3mm (85-116 GHz & 219-266 GHz) survey
(by Woods et al., 2003A&A...402..617W)
(click to (un)fold
contents)
 |
The survey was performed towards 7 massive carbon stars (AFGL
4078, IRC+10216, CIT 6, AFGL 4211, IRAS 15194-5115, AFGL 3068, IRC+40540),
using SEST (15m) and OSO (20m) telescopes. |
 |
Totally 47
transitions were identified to 24 molecules.
IRC+10216 were observed by both SEST and OSO. |
 |
All the carbon star show similar chemical abundances (with few
exceptions), and so similar chemistry. |
 |
The
largest changes of abundances occurred for
species reflecting different 12C/13C ratios and
SiO. |
 |
All the abundances can be explained by shock chemistry in
the inner CSE and photochemistry in the outer CSE. |
ARO
1.3mm & 2mm (131.2-160.3, 219.5-245.5 & 251.5-267.5 GHz) survey
(by He et al., 2008ApJS..177..275H)
(click to (un)fold
contents)
 |
360
lines (among all 377 detected lines)
are identified to 57 known species
(including 29 rare isotopomers and 2 cyclic isomers). |
 |
Abundance
differences among the three 13C substituted HC3N
are found. |
 |
The first detection of lines of 13CCH and
HN13C are reported
in IRC +10216. |
 |
Abundances
were derived for 15 species. |
An ARO 12m 2 mm spectral
line survey database is available at http://www.cv.nrao.edu/Turner2mmLineSurvey/.The
survey was done by Dr. B. E. Turner but not published.

Individual mm line observations (go to top)
Beside the mm spectral line surveys above, all individual observations of following species are searched
for in ADS before 2008 with criteria: source = "CW Leo" and keywords/abstract = "(major isotopic species
name or formula)".
AlCl, AlF, C2H, C2S, CH3CN, CN, CO, CS, C3H,, C3H2, C3N, C3S, C4H, C4H2, H2CO, HCN, HC3N, MgNC, NaCN, NaCl, PN,
SiC, SiCC, SiN, SiO, SiS.
 |
H2 (click to (un)fold contents)
 |
A nominal H2 column
density of CW Leo can be calculated this way: assuming a constant mass loss rate
Mlr = 2x10⁻⁵ Msun/yr, constant outflow velocity
Vexp = 14.5 km/s and outer radius of R = 1017 cm, we have
N(H2) = Mlr * (R/Vexp) / PI / R^2 / m_H2
= Mlr / PI / R / Vexp / m_H2
Here m_H2 is mass of a H2 molecule. Therefore, average H2 column density is a function of source
size under consideration. If we are comparing a species that
extends out to the whole CSE (with R = 10^17 cm,
e.g., CO) with H2, then the average N(H2) =
~4x10^20 cm^-2 within that sphere. If we are comparing a
centrally confined species (with R = 10^14 cm,
e.g., CS,v=1) with H2, then the average N(H2) = ~4x10^23 cm^-2 within the small volumn.
|
 |
background field star optical spectroscopy showed
that the H+H2 column density at an offset
of 37" from the central star of CW Leo is ~ 2x10²¹
cm-2. DIB absorptions are weak. K I resonance lines
are stronge, with broad line width of ~ 30 km/s (FWHM = 29.45 km/s from
their spectral plot. my speculation: it means the
size of the K I component of the CSE is >> 37", because the
steady outflow velocity is 14.5 km/s.) (from
Kendall et al., 2002A&A...387..624K)
|
|
 | CO (click to (un)fold contents)
 |
Detected CO, 13CO, J=1-0 and
HCN, H13CN, J=1-0 lines from CW Leo using the NRAO 36-foot 11m telescope.
The source diameter determined by 5-point mapping is
136"+-30" for CO and 40" for HCN. (from Wilson et al.,
1973ApJ...183..871W)
|
 |
CO and 13CO, J=1-0 lines were observed using NRAO 11m
telescope to CW Leo 1975 March. (from Kuiper et al., 1976ApJ...204..408K)
|
 |
CO,J=2-1 was mapped
using NRAO 11m telescope towards CW Leo, CIT 6, CRL 2688 and NGC 7027.
The line intensity was unexpectedly high for all four stars. The FWHM
source size was 54" for CW Leo (after
deconvolution with a beam width of 26"). (from Wannier et al., 1979ApJ...230..149W)
|
 |
NRAO 36 foot (11m) telescope detected CO, J=1-0. (from Cummings et al., 1980ApJ...235..886C)
|
 |
The asymmetry of CO 1-0 and 2-1 line profiles was analysed. The
existance of turbulance is responsible for
the missing blue wing of optically very thick
lines. (from Huggins & Healy, 1986ApJ...304..418H)
|
 |
CO,J=7-6 was detected
using bolometer of 2.24m telescope of the University of Hawaii during
March of 1987. (from Wattenbach et al., 1988A&A...202..133W)
|
 |
Strip maps of CO,J=1-0 and 2-1 were done using the Onsala 20m and NRAO 12m telescope. CO emission was found out to a
radius of 120". The deconvolved FWHM source sizes were:
23" for CO,J=1-0 measured by OSO, 33" for CO,J=1-0 measured by NRAO 12m, 36" for CO,J=2-1 measured by NRAO 12m (calculated from their table 1 data). The best fit model had mass loss rate of
4x10^-5 Msun/yr and dust-gas momentum transfer efficiency of
Q=2.35x10^-2, CO/H2 =
6X10^-4. (from Huggins et al., 1988ApJ...332.1009H)
|
 |
IRAM 30m mapped CW Leo in CO,J=1-0 and
2-1. The deconvolved FWHM source sizes were
38.7" for J=1-0 and 16" for J=2-1. A
two-shell model was used to derive better fitting to observational
data: a hot core with r < 4.2", mass loss rate =
2.5x10^-5 Msun/yr, dust-gas momentum transfer efficiency
Q = 8x10^-2; an extended outer region with r > 4.2", mass loss rate = 4x10^-5 Msun/yr, Q =
0.6x10^-2. (from Truong-Bach, 1991A&A...249..435T)
|
 |
The JCMT single dish (beam size 15") mapping of CO,J=3-2 showed a FWHM source size of 23",
so a Gaussian source size can be derived as 13". The maximum brightness temperature at
the source center was about 38 K, lower than that of HCN (53 K), which
was thought to be because CO is collisionally excited while HCN is
mainly radiatively excited. (from Williams and White, 1992A&A...266..365W)
|
 |
CO,J=3-2 and 13CO,J=3-2 were observed using CSO (10.4m). (from
Wang et al., 1994ApJS...95..503W)
|
 |
The ISO LWS spectrum (43-197um) of CW Leo show a lot of emission lines on the
top of smooth continuum emission (mainly in the long wavelength part where continuum
emission is weaker). They are identified to be high J rotational lines
of CO (Jup = 14-39) and a forest of HCN rotational lines in the ground and
different vibrational states (nu1=1, nu2=1,2^0,2^2, nu3=1) with Jup = 18-48. The molecular
emission comes from the hot and dense part of the CSE.(from Cernicharo et al.,
1996A&A...315L.201C)
|
 |
Asymmetry found at large scale.
Exccess emission is found between -18.3 to -14.3 km/s in the red wing of the
CO 1-0 line profile of IRC +10216 on June 25, 1996 and confirmed on January
15-16, 1997, but is absent on April 3-4, 1997 and June 3-4, 1998 (using IRAM
30 telescope). Comparing with other observations, they found that the CO 1-0
line shapes are very similar over most epoches with the exception that the
June 1996 and January 1997 spectra clearly show the
excess emission near the
red wing. This red excess is found in CO 2-1 line profiles by quantitative
comparison as well, but less prominent. This trantient feature could be
interpreted as localized episodic ejection from the star. But this
feature can be found only by high spectral
resolution data (100 KHz or better). They performed spectral mapping of
the CO J=1-0 and 2-1 and HCN 1-0 lines using the IRAM single dish in April
1997. Offset spectra show distinct features in -18 to -14 km/s
(corresponding to the excess found in June 1997), -34 to -22
km/s, and -40
to -34 km/s ranges. There is good correspondace between CO 1-0 and 2-1 lines
for these features. The spatial distribution of these features are not
spherical. The peak of HCN 1-0 line is about 5-10 arsec away from the
center, with a position angle of 45 deg. (Groenewegen
& Ludwig, 1998A&A...339..489G)
(Figures
from left to right: (1) Red part of CO 1-0 spectra, from top to bottom on
June 1996, January 1997, April 1997 and June 1998; (2) comparing CO 1-0
(left) 2-1 (right) at different epoches: From top to bottom Sep. 1988, Aug.
1991, Dec. 1994, Jan. 1995, May 1996, June 1996, Jan. 1997, April 1997, June
1998; (3) Spectral maps of CO 1-0 upto 110 arcsec from the central star (78
kHz resolution), North is up, East is right; (4) same as (3) but for CO 2-1
(312 kHz resolution); (5) same as (3) but for HCN 1-0; )
![[FIGURE]](img5_small.gif) _ _![[FIGURE]](img9_small.gif) _ _
![[FIGURE]](img16_small.gif) _ _![[FIGURE]](img18_small.gif) _ _![[FIGURE]](img20_small.gif)
|
 | JCMT single dish mapping of multi-transitions of CO and 13CO to CW
Leo, together with detailed heat balance (dust-gas
collision, photoelectric heating,
cooling by 12CO, 13CO, HCN, H2 emission and adiabatic cooling) and LVG modeling, constrained
the parameters of the star as: L* = (1.0-1.5)x10^4
Lsun, distance = 100-150 pc, mass loss rate = 1.5+-0.3 x 10^-5 Msun/yr, dust to gas ratio = 700+-100, 60um opacity = 250
cm^2/g, CO/H2 = 1.1x10^-3. But the
fits to CO,J=3-2,7-6 and 13CO,J=6-5 were not satisfactory. Enhanced mass loss rate might be necessary to fit
the maps at r > 50". (from Groenewegen et al.,
1998A&A...338..491G)
|
 |
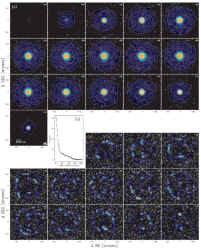
BIMA interferometer masaic plus NRAO 12M single dish
data revealed multiple shell like structure
in the CO, J=1-0 map. CO is detectable out
to radius of 140". The radii of the
multiple shells range from 26"-120",
while the inter-shell timescales range from 1300-2900
years. The shells could be formed by episodic enhancement of mass
loss rate. (from Fong et al., 2003ApJ...582L..39F)
(figure: upper left -- masaic CO
channel maps; middle -- radial intensity profile; lower
right -- background subtracted CO channel
maps.)
|
 |
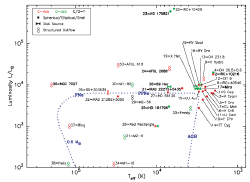
BIMA plus NRAO 12M combined imaging survey of CO,J=1-0 for a sample of AGB-PPN-PN sources were
performed. For CW Leo, the CO emission extends out to a radius of
190". The FWHM diameter is 37.5"
(measured from their PV diagram contour). The CO envelope looks quite spherical, only with a
little elongation in S-N direction in the central region in the
systemic velocity channel. The source morphologies were classified into
three classes: spherical/elliptical/shell sources,
disk sources, and structured
outflow sources. The mass loss rates are correlated with the CSE
sizes for circular and outflow sources, but not for disk sources whose source sizes are determined by disk evolution.
(from Fong et al., 2006ApJ...652.1626F)
(figure: distribution of the 38 mapped
sources on L-R diagram.)
|
 |
They detected for the first time CO v=1, J=3-2, 2-1 line from CW Leo, using SMA. The line widths are around 8 km/s from their spectral plots. The 2"
resolution didn't get the emission region resolved. (from Patel et al., arXiv:0811.4736)
|
|
 |
Al containing molecules (click to (un)fold contents)
 |
The first detection of metal halides AlCl, Al37Cl, KCl and possibly AlF was reported. The 35Cl/37Cl
= 2.3+-0.5 (terrestrial value is 3.1).
(from Cernicharo and Guelin, 1987A&A...183L..10C)
|
 |
source size of AlF is 5"-10"
(comparing CSO and IRAM spectra), N = (0.3-1.1)x1015
cm-2, equivalent to a relative abundance AlF/H2 = 10-9. MgF, CaF were searched
but not found. It is suggested that F is produced not in SNe, but in the
He flash of AGB stars. (from Ziurys et al., 1994ApJ...433..729Z)
|
 |
AlCl/H2 = 2.2x10⁻⁷. Highberger
et al., 2001,
ApJ, 562, 790
|
 |
AlNC was detected in CW
Leo for the first time. Source size is >20"
and shell like (judged from the U shaped profile, very different from
AlCl and AlF). Tex = 60K, Nrot = 9x1011 cm-2, AlNC/H2 = 3x10⁻¹⁰. (from Ziurys et
al., 2002ApJ...564L..45Z)
|
 |
IRAM 30m detected Al37Cl, J=17-16 line and estimated an
abundance of Al37Cl/H2 = (2-8)x10^-8, ten times higher than previous values.
(from Ford et al., 2004ApJ...614..990F)
|
|
 |
K containing molecules (click to (un)fold contents)
 |
The first detection of metal halides AlCl, Al37Cl, KCl and possibly AlF was reported. The 35Cl/37Cl
= 2.3+-0.5 (terrestrial value is 3.1).
(from Cernicharo and Guelin, 1987A&A...183L..10C)
|
|
 |
Mg containing molecules (click to (un)fold contents)
 | The first detection of MgCN
in CW Leo by observations with NRAO 12m and IRAM 30m telescopes. Column
density was ~10^12 cm^-2. The abundance
ratio MgNC/MgCN = ~22. It could be formed
by reactions between Mg and HNC or CN or grain surface chemistry in the
outer CSE:
Mg+ + HNC => MgCNH+ + h*nu,
MgCNH+ + e- => MgCN + H.
MgCN may not be directed formed from MgNC, because of the large barrier
for isomerization. Therefore, the MgNC/MgCN ratio
may reflect the HNC/HCN ratio. (form
Ziurys et al., 1995ApJ...445L..47Z)
|
 | The first identification of MgNC
in IRC+10216 with the help of laboratory measurements. The column
density of MgNC is 1-2x10^13 cm^-2, and Tex
= 15 K. (from Kawaguchi et al., 1993ApJ...406L..39K)
|
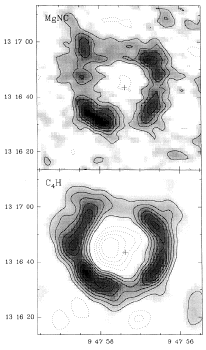
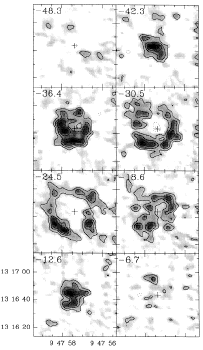
 | PdBI imaging showed MgNC,N=8-7
in a patchy hollow shell of radius 15"
(4.5x1016 cm). The shell is displaced by 2" from the
compact mm/IR central source, indicating binary
star. The similar shell radius of MgNC, C3H and C4H indicates
that they may be formed though fast time dependent
chemistry such as desorption from dust grains. (from Guelin et al., 1993A&A...280L..19G)
(figure: left upper --
MgNC channel map around Vlsr; left
lower -- C4H channel map
around Vlsr; right -- channel maps of MgNC.)
|
 |
Detected 25MgNC and 26MgNC and possibly 26AlF
in CW Leo. Isotopic ratios: 24Mg:25Mg:26Mg =
78:11+-1:11+-1 (similar as solar values: 79.0:10.0:11.0). This
implies 3 Msun < Minit < 5 Msun.(from Guelin et al., 1995A&A...297..183G)
|
|
 |
Na containing molecules (click to (un)fold contents)
 |
The first detection of metal halides NaCl, Na37Cl was reported. The 35Cl/37Cl = 2.3+-0.5 (terrestrial
value is 3.1). NaCl size is <= 15" by comparing the line profile and
width with that of SiS and C4H.Tex and
column density N for NaCl
are 17K and 5x10¹²
cm-2 (for size of 15") or 16K and 3x10¹³
cm-2 (for size of 3").(from Cernicharo and
Guelin, 1987A&A...183L..10C)
|
 |
NaCN/H2 = 10-7. (size of 5") Guelin
et al., 1997
|
|
 |
C2H (click to (un)fold contents)
 |
BIMA interferometry mapping showed a ring like
distribution of C2H N=1-0 with a
diameter of 20"+-4". The peak
relative abundance is C2H/H2 = 1.8x10⁻⁶ at
radius of 6x1016 cm. It was concluded that C2H is solely a product of photodissociation from
C2H2 at a radius > 3x1016 cm. (from
Bieging and Nguyen-Quang-Rieu, 1988ApJ...329L.107B)
|
 |
OSO single dish mapping observation of C2H,N=1-0 (87 GHz) with beam width of 44"
revealed the FWHM source sizes of 43". The column density determined from modeling is 1.6x10^15 cm^-2.
(from Truong-Bach et al., 1987A&A...176..285T)
|
 |
Several lines of C2H
around 87 GHz were detected in the first run of IRAM 30m telescope
during May 1985. (from Lucas et al., 1986A&A...154L..12L)
|
|
 |
C3H (click to (un)fold contents)
 | NRAO 11m + OSO 20m + Bell 7m single dish
observation identified C3H with
Jup = 7/2, 9/2, 13/2, 15/2 in ^2^PI_1/2 ladder and Jup=9/2
in ^2^PI_3/2 ladder in CW Leo.
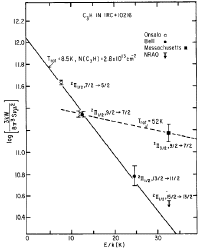
With fine structure level splitting, it was found that Tex = 8 K within each
2PI1/2 ladder and 52 K across ladders. The reason
was thought to be that far-IR transitions across ladders are only weakly allowed. The source size is about
84", column density is 2.8x10^13 cm^-2. The excitation of
C3H is similar as that of SiCC in this star. (The source size
is determined by two beam method: the line temperature in the 40" beam of Onsala telescope
is 2.4 times tronger than in the 130" beam of the Bell telescope, assuming uniform intensity distribution,
a source size of 84" were derived.) (my comments: if
we assume the source has a gaussian intensity distribution, the FWHM source size would be
97".) The column density of C3H is one order of magnitude smaller than that of
C2H and C4H, and so they concluded that acetylenic chain radicals with one H atom and even number of C is more abundant than that with odd number of
C. (from Thaddeus et al., 1985ApJ...294L..49T)
(figure: rotational diagram that
shows the difference between the two fine structure states.)
|
 |
PdBI imaging showed C3H,^2^PI_1/2,J=9/2-7/2
in a patchy hollow shell of radius 15"
(4.5x1016 cm). The shell is displaced by 2" from the
compact mm/IR central source, indicating binary
star.(from Guelin et al., 1993A&A...280L..19G)
|
|
 |
C4H (click to (un)fold contents)
 | Quantum mechanical calculations using matrix
Hartree-Fork model gave theoretical rotation constants of Be = 4753 MHz for C4H
and Be = 4955 MHz for C3N.
(from Wilson & Green, 1977ApJ...212L..87W)
|
 | Four pairs of C4H doublets
were detected towards CW Leo. The rotational and spin doubling constants
derived from the astronomical data are B0 =
4758.48 +-0.10 MHz and gamma = 38.7 +-1.0
MHz. The column density of C4H could be between
4x10^14 and 5x10^15 cm^-2. But the sign of
gamma is still unknown due to the low quality of observed data. If gamma
is positive, the upper component will be 10% stronger than the lower; if
gamma is negative, the inverse is true. (from Guelin et al., 1978ApJ...224L..27G)
|
 | NRAO 36 foot (11m) telescope observed two pairs of well separated fine structure lines of
C4H near 10 GHz. In principle, for each pair of fine structure lines, the
high-frequency member to low-frequency member line ratio depends on the sign of the
spin-rotation constant gamma: it is > 1 for gamma positive; <1 for gamma negative. The observed
ratio is 1.06+-0.16 and 1.09+-0.23 for the N=10-9 and 11-10 pairs respectively,
demonstrating that gamma is positive for C4H.
(from Cummings et al., 1980ApJ...235..886C)
|
 |
The pair of fine structure lines C4H,J=10-9 around 95 GHz were detected in the
first run of IRAM 30m telescope during May 1985. (from Lucas et al., 1986A&A...154L..12L)
|
 |
The first detection of fine structure rotational
lines pairs from C4H,nu7=1^1 were reported. The nu7=1^1 state lies ~ 300 K about ground state. Trot = 35+-5 K, N =
1.1(+-0.4)x10^15 cm^-2 (this is the value
converted from the paper by adopting new dipole moment of 0.87D from CDMS).
(NOTE: Now we know from CDMS database that these
lines are from nu7=2^0 state!!). (from Guelin et al., 1987A&A...182L..37G)
|
 |
Laboratory measurement of C4H
rotational lines were performed and rotational
constants and line frequencies were
calculated for ground and vibrational states. 22 unidentified lines were
assigned to C4H and its vibrational states.
The lines detected by Guelin et al. (1987A&A...182L..37G)
were now assigned to nu7=2^0. The low lying of the varous vibrational
states of C4H indicates that the spin-orbital
coupling is very strong and the coupling constant gamma is negative. The detected nu7 = 2^2 lines
in CW Leo seem to be much weaker than nu7 = 1^1 and 2^0 lines, the
pumping mechanism could be directly radiative
pumping from the ground state to the nu7 = 1^1 and 2^0 states,
because the nu7 = 2^2 is not radiatively connected with the ground
vibrational state. (from Yamamoto et al., 1987ApJ...323L.149Y)
|
 |
PdBI imaging showed C4H, N=10-9
in a patchy hollow shell of radius 15"
(4.5x1016 cm). The shell is displaced by 2" from the
compact mm/IR central source, indicating binary
star. (from Guelin et al., 1993A&A...280L..19G)
(figure: upper -- MgNC
channel map around Vlsr; lower -- C4H channel map around Vlsr)

|
 |
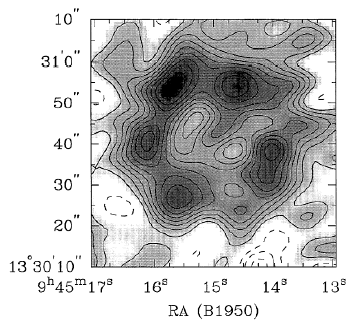
The N=9-8 line of C4H was mapped by BIMA.
The ring-like distribution has a diameter
of 30", with brightness temperature of
0.88 K at the peak. The half-peak ring thickness
was estimated to be 15". The peak
abundance was derived to be C4H/H2 = 1.8x10^-6 at
the peak (r=16.7"), a factor of 5 higher than previous model
predictions. (from Dayal & Bieging, 1993ApJ...407L..37D)
(Figure: C4H Vlrs channel map.)
|
 |
The rotational lines of the carbon chain anion C4H-
were detected in CW Leo. The similarity of line profiles fo C4H and C4H-
indicates the coexistence of the two in the
CSE. For C4H, Trot =
35 K, N = 3x10^15 cm^-2; for c4H-, Trot = 23+-2 K,
N = 7.1+-0.2x10^11 cm^-2, 4200 times lower
than C4H. The parameters of C6H- were also
calculated from their observations to be Trot =
27+-2 K, N = 4.1+-1.5x10^12 cm^-2.
The neutral C6H (2PI3/2) has Trot = 31+-2 K, N =
6.6+-2.0x10^13 cm^-2. Therefore, the abundance ratios are C6H-/C6H = 1/16, C4H-/C6H-
= 1/6. They also calculated the radiative association rates of
electron with C4H and C6H: Kratt(C4H) = 1.6x10^-10
cm^3/s, Kratt(C6H) = 4x10^-8 cm^3/s.
C8H- was predicted to be detectable in CW
Leo because C8H has been detected and the radiative association rate is
expected to be larger for larger molecules. (from Cernicharo et al., 2007A&A...467L..37C)
|
|
 |
C5H (click to (un)fold contents)
|
 |
C6H (click to (un)fold contents)
 |
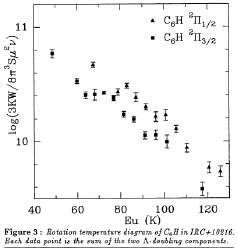
IRAM single dish spectral line profiles of C6H indicates a uniform disk source size of 25" (flat top with 30" beam and U shape with 22"
beam). Rotation diagram analysis gave Trot = 30 K,
N = 3 x 10^14 cm^-2 (in the two fine structure states:
2PI3/2 and 2PI1/2). The two fine structure states of C6H showed different but parallel distribution
in the rotation diagram. This was explained as that the two states were not in equilibrium with each
other. They also showed that the column densities
of different species decreases with increasing number of atoms (among CN, C3N, C2H, C3H, C4H, C5H, C6H, HCN, HC3N, HC5N, HC7N, HC11N, and HNC).(from Cernicharo et al., 1987A&A...181L...1C)
(figure: rotation diagram of C6H
that show difference between the two fine structure lines.)
|
 |
The rotational lines of the carbon chain anion C4H-
were detected in CW Leo. The similarity of line profiles fo C4H and C4H-
indicates the coexistence of the two in the
CSE. For C4H, Trot =
35 K, N = 3x10^15 cm^-2; for c4H-, Trot = 23+-2 K,
N = 7.1+-0.2x10^11 cm^-2, 4200 times lower
than C4H. The parameters of C6H- were also
calculated from their observations to be Trot =
27+-2 K, N = 4.1+-1.5x10^12 cm^-2.
The neutral C6H (2PI3/2) has Trot = 31+-2 K, N =
6.6+-2.0x10^13 cm^-2. Therefore, the abundance ratios are C6H-/C6H = 1/16, C4H-/C6H-
= 1/6. They also calculated the radiative association rates of
electron with C4H and C6H: Kratt(C4H) = 1.6x10^-10
cm^3/s, Kratt(C6H) = 4x10^-8 cm^3/s.
C8H- was predicted to be detectable in CW
Leo because C8H has been detected and the radiative association rate is
expected to be larger for larger molecules. (from Cernicharo et al., 2007A&A...467L..37C)
|
|
 |
C7H (click to (un)fold contents)
 |
First detection of C7H in CW Leo was reported. It's concluded that the acetylenic chain radicals with even number of C are
more abundant than that with odd number of C. (from Guelin et al., 1997A&A...317L...1G)
|
|
 |
C8H (click to (un)fold contents)
 |
First detection of 10 lines of C8H in CW Leo was reported.
(from Cernicharo & Guelin, 1996A&A...309L..27C)
|
|
 |
C4H2 (click to (un)fold contents)
 | Eight transition of H2CCCC
(an isomer of diacetylene) between 80-135
GHz were detected by IRAM 30m in CW Leo. Tex = 20
+-3 K, column density averaged over a beam of 25" was N = (1.6+-0.4)x10^13 cm^-2. (from Cernicharo et
al., 1991ApJ...368L..43C)
|
|
 |
CH3CCH (click to (un)fold contents)
|
 |
CN (click to (un)fold contents)
 | NRAO 36 foot (11m) telescope detected CN, J=1-0 series. (from Cummings et al., 1980ApJ...235..886C)
|
 | OVRO (beam 30") single dish mapping of CN in CW Leo and TMC-1, TMC-2. The deconvolved
source diameter of CW Leo was about 70". The CN
can be formed by photodissociation of HCN
in such a chain: HCN + h*nu => CN, CN + h*nu => C I, C I + h*nu
=> C II. Model calculation for CW Leo (with Mlr = 1.5x10^-4 Msun/yr)
showed that peak CN abundance occurs at r =
1.7x10^17 cm, and falls to 1/e at r = 2.8x10^17 cm. Modeled CN column density is 4.8x10^15 cm^-2,
including those CN in the far radius where they are not excited. (from
Wootten et al., 1982ApJ...257..151W)
|
 | The first detection of 13CN
in space by Bell 7m telescope (FWHM beam size 1.8') were reported in CW
Leo, Sgr B2 and Ori A. A isotopic ratio 12CN/13CN = 10 were derived (for
the same source size as CN: 70"), indicating a column density of N(13CN) = (1-5)x10^14 cm^-2. (from Gerin et al., 1984A&A...136L..17G)
|
 | OSO single dish mapping observation of CN,N=1-0 (113 GHz) with beam width of 44"
revealed the FWHM source sizes of 77". The column
density determined from modeling is 5.4x10^15 cm^-2.
(from Truong-Bach et al., 1987A&A...176..285T)
|
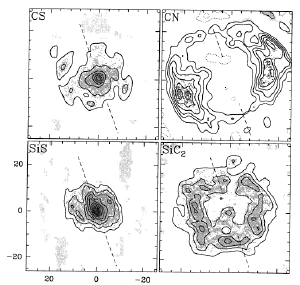
 | PdBI + IRAM 30m single dish mapped CS,J=2-1, SiS,J=5-4, CN,N=1-0
and SiCC,4(2,3)-2(2,2), found incomplete ring like distribution of CN and SiCC. The CN
ring show an axis along PA of 20 degree. The ring size of CN measured from the contour map was 39". (from Lucas et al., 1995Ap&SS.224..293)
(Figure: maps of molecules.)
|
 | BIMA interferometer mapping showed that CN appears
in a hollow shell with diameter of 32". Modeling showed that the
peak abundance of CN is 3.85x10^-6 at around 2.8x10^16 cm. (from Dayal
& Bieging, 1995ApJ...439..996D)
|
|
 |
C3N (click to (un)fold contents)
 | Quantum mechanical calculations using matrix
Hartree-Fork model gave theoretical rotation constants of Be = 4753 MHz for C4H
and Be = 4955 MHz for C3N.
(from Wilson & Green, 1977ApJ...212L..87W)
|
 | NRAO 43m telescope detection of C3N N=2-1 seems to be too weak than expected,
compared with other transitions in literature. (from Bell et al., 1992ApJ...400..551B)
|
 | The pair of C3N,N=9-8
fine structure lines around 89 GHz were detected in the first run of
IRAM 30m telescope during May 1985. (from Lucas et al., 1986A&A...154L..12L)
|
 | BIMA interferometer mapping of C3N,N=11-10 showed that it has a ring-like brightness
distribution with diameter of 36".
(from Bieging & Taffala, 1993AJ....105..576B)
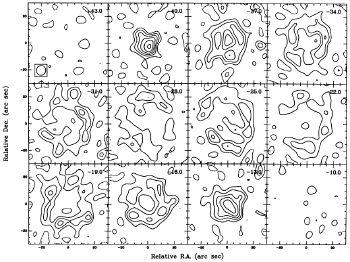
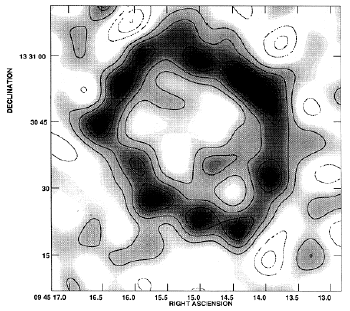
(Figure: left -- C3N
channel maps; right -- C3N integrated Vlsr map averaged for the
spin doublets.)
 _ _
|
|
 |
HNC (click to (un)fold contents)
 | BIMA interferometer mapping showed a ring like
distribution of HNC,J=1-0 with a diameter
of 34". The peak relative
abundance is HNC/H2 = 2.3x10⁻⁸ at
a radius of 4x1016 cm. It was concluded that HNC is produced by photochemistry reactions involving HCN at radius > 3x10^16 cm.
(from Bieging and Nguyen-Quang-Rieu, 1988ApJ...329L.107B)
|
|
 |
HCN (click to (un)fold contents)
 | HC14N and H13C14N J=1-0 lines were detected in CW
Leo, using the NRAO 36-foot (11m) telescope. (from Morris et al., 1971ApJ...170L.109M)
|
 | Detected CO, 13CO, J=1-0 and HCN,
H13CN, J=1-0 lines from CW Leo using the
NRAO 36-foot 11m telescope. The source diameter
determined by 5-point mapping is 136"+-30" for CO and
40" for HCN. (from Wilson et al., 1973ApJ...183..871W)
|
 | Onsala 20m telescope (FHPBM = 41"-52")
mapping of HCN,J=1-0, HNC,J=1-0, H13CN,J=1-0 gave deconvolved gaussian source
diameters of 41" for HCN, 34" for H13CN and 34" for HNC. The
derived abundances are 1.1x10^-5 (assuming
12C/13C=40) for HCN, 2.75x10^-7 for H13CN, 3.9x10^-8 for HNC. (from Olofsson et al., 1982A&A...107..128O)
|
 | BIMA interferometer mapping of HCN,J=1-0 showed that there exists a wide
non-guassian skirt in addition to centrally peaked spherical
distribution. The FWHM source size is 20",
and it extends to a FWHM of 45" at 2 K brightness contour. The excitation of
HCN is controlled by radiative pumping
through 14um vibrational band. There is a HCN density
enhancement at a radius around 4x10^16 cm. The outer boundary of HCN is at around 10^17 cm,
determined by photodissociation. (from Bieging et al., 1984ApJ...285..656B)
|
 | The possible maser line HCN,(0,2^0,0),J=1-0
around 89 GHz were detected in the first run of IRAM 30m telescope
during May 1985. (from Lucas et al., 1986A&A...154L..12L)
|
 | The vibrationally exicted HCN
lines (02^{0}0) and (01^{1c,1d}0),J=3-2 were observed in space for the first time (in Ori-KL and/or CW Leo). Through
modeling, they found HCN/H2 abundance
distribution in the CSE of CW Leo: x(0,1,0) = 3x10^-6 * r^-4
and x(0,2,0) = 7x10^-7 * r^-4.(from Ziurys
& Turner, 1986ApJ...300L..19Z)
|
 | A survey of HCN millimeter maser towards 85 carbon
stars resulted in 6 new HCN maser sources.
All masers sources have mass loss rate between 10^-6
to 10^-5 Msun/yr and have similar IR
properties. Time variation occurs on
month scales. (from Lucas et al., 1988A&A...194..230L)
|
 | The strong possible maser
emission HCN (01^{1c}0),J=2-1 was detected
by IRAM 30m. They detected all HCN lines: v=0,J=J=3-2,2-1,1-0;
(01^{1c,1d}0),J=3-2,2-1; (02^{0}0),J=3-2,2-1,1-0; (02^{2c,2d}0),J=3-2. The flux density is about 400 Jy.
The possible maser pumping mechanism could be IR
dust emission pumping or line
overlap in IR. (from Lucas & Cernicharo, 1989A&A...218L..20L)
|
 | HCN and HCCCN were observed using OSO 20m, NRO 45m and
CSO 10m telescopes towards 8 carbon stars
(including CW Leo). The 14N/15N was found
to be 5300 for CW Leo (assuming 12C/13C =
48). 29SiO/28SiO = 0.065+-0.004. (from
Wannier et al., 1991ApJ...380..593W)
|
 | The JCMT single dish (beam size 15") mapping
of HCN,J=4-3 showed a FWHM size of 20",
so a Gaussian source size can be derived as 13". The maximum brightness temperature at
the source center was about 53 K, higher than that of CO (38 K), which
was thought to be because CO is collisionally excited while HCN is
mainly radiatively excited.
(from Williams and White, 1992A&A...266..365W)
|
 | IRAM PdBI interferometer mapping of HCN,(0,2^0,0),J=1-0 line in CW Leo didn't
significantly resolve it. The continuum is marginally resolved. Gaussian fit of the continuum visibility curve gives a FWHM diameter of
1.1"+-0.2". Assuming an upper limit of source size of 1", the lower limit of brightness temperature of the line was 2000K, indicating a
weak maser action. The measured continuum peak position was (RA,DEC,J2000):
09h47m57.394s, 13d16m43.65s to an accuracy of 0.05" in both directions.
(from Lucas &
Guilloteau, 1992A&A...259L..23L)
|
 | HCN,J=4-3 was observed
using CSO (10.4m). (from Wang et al., 1994ApJS...95..503W)
|
 | BIMA interferometer mapping showed that the J=1-0
lines of HCN and H13CN appear
concentrated towards the central star, with a FWHM diameter of 18" and 16.4"
respectively. The column density of H13CN was derived by modeling to be 7.8x10^-7. Adopting a 12C/13C = 35+-5 from
literature, the HCN abundance was obtained to be 2.7x10^-5.
(from Dayal & Bieging, 1995ApJ...439..996D)
|
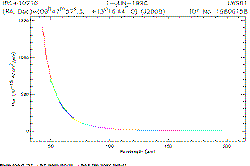
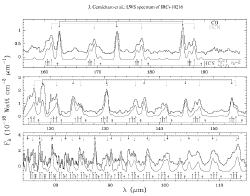
 | The ISO LWS spectrum (43-197um) of CW Leo show a lot of emission lines on the
top of smooth continuum emission (mainly in the long wavelength part where continuum
emission is weaker). They are identified to be high J rotational lines of CO (Jup = 14-39) and
a forest of HCN rotational lines in the ground and different
vibrational states (nu1=1, nu2=1,2^0,2^2, nu3=1) with
Jup = 18-48. The molecular emission comes from the hot and dense part of the CSE.
LVG model yields the best fit to the spectrum with HCN/CO = 0.1, corresponding to abundance of
HCN/H2 = 3x10^-5. In far-IR, lambda>70um, the luminosity of HCN lines is 0.44 Lsun, higher than 0.28 Lsun of CO,
and so HCN is the major coolant at FIR in CW Leo.
(from Cernicharo et al., 1996A&A...315L.201C)
(figure: left -- ISO LWS spectrum; right -- continuum subtracted
FIR line spectra.)
|
 | The HCN,(04^00),J=9-8 laser transition was detected in CW Leo. Because
the lower energy level is 4200 K above the ground state, this laser must
arise from the inner most part of CSE. The
laser may be chemically pumped. A vibrational temperature of 1000K was derived by fitting line intensities from 01^{1}0,02^{0}0,02^{2}0,04^{0}0,11^{1}0 states.(from Shilke
et al., 2000ApJ...528L..37S)
|
 | SiO,J=5-4,8-7 and HCN,J=3-2,4-3 were detected towards CW Leo and other M, S, C type AGB stars.
V Cyg was found to show possible maser emission in HCN,(0,1^1c,0),J=3-2,4-3 lines. HCN in M stars
is suggested to be produced in the central region by shock
chemistry. HCN/SiO ratio increases with increasing mass loss rate for M and S stars.
(from Bieging et al., 2000ApJ...543..897B)
|
 | HHT observations showed that HCN
01^{1c}0,J=3-2, 4-3 showed maser action in five carbon stars: R Scl, V384 Per, R Lep, Y CVn, and V Cyg (out of 12 survey stars). (from Bieging, 2001ApJ...549L.125B)
|
 | Laser emission near
891 GHz was found from the J=10-9 between 11^10 and 04^00 vibrational
states of HCN towards three carbon stars CW Leo, CIT 6 and Y CVn. The laser line may arises from the very
inner hot CSE region. Together with another laser near 805 GHz from the
J=9-8 transition within the 04^00 state, they will be ideal targets for ALMA to resolve the dust
formation region in future. Temporal
variation in the maser lines is evident with repeated
observations half year apart. (From Schilke & Menten, 2003ApJ...583..446S)
|
 | Sub-arcsec mapping of H13CN,J=8-7
in CW Leo by the SMA showed a diameter <
1". Excitation analysis showed the
abundance of H13CN/H2 = 4x10^-7 in the inner
wind (r<5x10^15 cm). Then adopting a 12C/13C = 50, the HCN abundance is 2x10^-5.
The abundances do not change much out to the outer CSE. Also shown a
single dish observations of J=1-0, 3-2, 4-3 and
8-7 lines. It was concluded that non-equillibrium chemistry in
the extended atmosphere doesn't affect the abundance of H13CN much.
(from Schoier et al., 2007ApJ...670..766S)
|
|
 |
HC3N (click to (un)fold contents)
 | Onsala 20m telescope (FHPBM = 41"-52")
mapping of HC3N,J=10-9 gave deconvolved
gaussian source diameters of 30".
The derived abundance is HC3N/H2 = 2.1x10^-6.
(from Olofsson et al., 1982A&A...107..128O)
|
 | One line H13CCCN,J=11-10
around 97 GHz were detected in the first run of IRAM 30m telescope
during May 1985. (from Lucas et al., 1986A&A...154L..12L)
|
 | HC3N,J=12-11 was mapped using Owens Valley Interferometer to show a
ring distribution with diameter of
25". (no map shown). (from Likkel et al., 1987BAAS...19..755L)
|
 | BIMA interferometry mapping showed a ring + central
component distribution of HC3N,J=10-9 with
a ring diameter of 25"+-4". The
peak relative abundance is HC3N/H2 = 1.5x10^-7 at peak radius of 4.5x10^16 cm. It was supposed
that, in radius < 3x10^16 cm, HC3N may be made by neutral reaction
HCNH+ + C2H2 -> H2C3N+ +
H2,
followed by dissociative recombination. But in radius > 3x10^16 cm, it could
be created by radical reaction
C2H2+ + HCN -> H2C3N+ + H,
where C2H2+ is photodissociation product of
C2H2. Longer acetylene chains in the outer CSE can be made in the similar way as the second reaction.
(from Bieging and Nguyen-Quang-Rieu, 1988ApJ...329L.107B)
|
 | HCN and HCCCN were observed using OSO 20m, NRO 45m and
CSO 10m telescopes towards 8 carbon stars
(including CW Leo). The 14N/15N was found
to be 5300 for CW Leo (assuming 12C/13C =
48). 29SiO/28SiO = 0.065+-0.004. (from
Wannier et al., 1991ApJ...380..593W)
|
 |
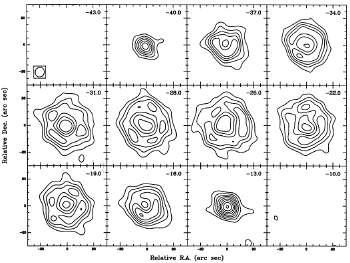
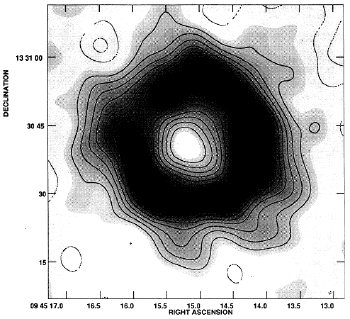
BIMA interferometer mapping of HC3N,J=12-11
showed that it has a ring-like brightness distribution with diameter of 28". (from Bieging & Taffala, 1993AJ....105..576B)
(figure: left -- HC3N
channel maps; right -- integrated Vlsr HC3N map)
 _ _
|
 |
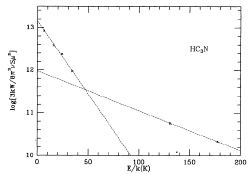
Two beam method was used to determine the Gaussian
source size of HC3N,Jup=8,9,10,11,12 to be 51". HC3N show warm and cool components on
its rotation diagram, with Trot = 12.7 K and
48 K respectively. (from Bell, 1993ApJ...417..305B)
(figure: rotation diagram of HC3N
that shows two components. Note that the two highest transitions were
calculated with source sizes of 18.5" and 18.0" (for lower and
higher), while the other lower transitions were calculated with biger
source size of 40".)
|
 |
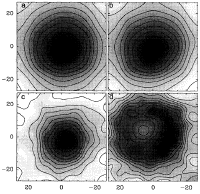
IRAM 30m single dish mapping of HC3N, J=16-15, 18-17, and 24-23 showed
centrally peaked distribution, quite different from lower transitions that showed
ring-like distribution. The center
of HC3N distribution is shifted from the shell center of C4H, as reported for MgNC observations
by Guelin et al. (1993). It was concluded that HC3N abundance in CW Leo should be higher than
previously determined and should peak at a smaller radius. The apparant
source sizes are 35" for J=16-15,
34" for J=18-17, 25" for J=24-23. With the beam size of 13", the
Gaussian source sizes can be derived as 32.5",
31.4"and 21.4"
respectively.
(from Audinos et al.,
1994A&A...287L...5A)
(Figures: The single dish maps of
HCN,J=16-15,18-17,24-23 and C4H,J=nu7 2PI_3/2, left to right and top to
bottom.)
|
|
 |
HCCNC (click to (un)fold contents)
 | HCCNC, J=9-8 was detected in CW Leo for the first time using ARO 12M telescope.
The line intensity indicates column density of N=8.4x10^12
cm^-2. The abundance ratio HCCNC/HC3N = ~130, which is 2-7 times higher than in TMC-1. The detection of HCCNC
means ion-molecule reactions are active in the CSE, while the large abundance ratio indicates
other chemical processes such as neutral-neutral reactions also contribute to the production
of HC3N. (from Gensheimer, 1997ApJ...479L..75G)
|
HC5N (click to (un)fold contents)
 | NRAO 43m telescope observation of HC5N in IRC +10216, Sgr B2 and TMC-1. Adopted C5H
source size for IRC +10216 is 50"
(from literature). Trot = 13(+12-4) K. No
column density was given. (from Jennings and Fox, 1982ApJ...254..111J)
|
 | Comparison of IR and collisional excitation of HC5N indicates that IR excitation through bending mode bands (nu7, nu8) is more efficient
than collision. IR excitation agree with observations in both high and low J. The abundance of HC5N was estimated to be
HC5N/H2 = 2.5x10^-7. (from Deguchi & Uyemura,
1984ApJ...285..153D)
|
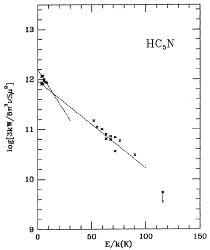
 | NRAO 140 foot (43m) telescope didn't find the nu10
and nu11 bending state lines of HC5N. This
was explained by the low excitation temperature of HC5N. Together with
literature data, the rotation diagram of ground state lines showed two
components:
a cooler components with diameter of 33",
Trot = 13 K, N = 3.2x10^14
cm^-2 and
a hotter component with diameter of 50",
Trot = 25 K, N =
3.7x10^14 cm^-2.
(from Bell et al., 1992ApJ...396..643B)
(figure: rotation diagram that
shows two components. The temperatures of the dotted lines are adopted
from literature.)
|
 | Two beam method was used to determine the Gaussian
source size of HC5N to be 30". Trot = 35 K.
(from Bell, 1993ApJ...417..305B)
|
|
 |
HC7N (click to (un)fold contents)
 |
Effelsberg telescope (beam size of 40" at
23.7GHz) observation of HC7N resulted in Tex =
133/FWHM^0.7 K and column density of 1.5x10^14
cm^-2. (from Nguyen-Q-Rieu et al., 1984A&A...138L...5N)
|
|
 |
HC9N (click to (un)fold contents)
 | NRAO 43m telescope observation of HC9N in IRC +10216 revealed its Trot = 12+-3 K.
Assuming a source size of 50", the
column density can be derived as N = 4.0x10^13
cm^-2. (from Bell et al., 1992ApJ...400..551B)
|
|
 |
HC11N (click to (un)fold contents)
 | Detection of HC11N was
reported by the observation during March and May 1981 at the Haystack
Observatory. The relative abundance is HC11N/H2 =
7.0x10^-8. HC11N was the heaviest molecule detected in space at
that time. (from Bell et al., 1982Natur.295..389B)
|
|
 |
CH2CHCN (click to (un)fold contents)
|
 |
CH2CN (click to (un)fold contents)
|
 |
HCP (click to (un)fold contents)
 | Detection of 4 rotational lines of HCP
in CW Leo was
reported by the observation in Juanuary of 2007 with the IRAM 30m
telescope. This is the third phosphorus bearing
species found in space (the first two are PN and CP). A
rotational temperature of 61 K and a column
density of 3x10^14 cm^-2 were derived by
assuming a source diameter of 12". Chemistry and radiative transfer
calculations reproduced the observed line profiles quite well. HC3P was
predicted to be detectable in carbon rich CSE. (from Agundez et al., 2007ApJ...662L..91A)
|
|
 |
CCP (click to (un)fold contents)
 | Detection of 5 rotational lines of CCP
in CW Leo was made by the ARO 12M observation . This is the fifth phosphorus bearing
species found in space. Parameters: Nrot = 1.2x10^-12 cm^-2, Trot
= 21 K, [CCP]/[H2] = 10^-9, source radius = 40" (from modeling). (from
Halfen et al., 2008ApJ...677L.101H)
|
|
 |
PH3 (click to (un)fold contents)
 | The J_k=1_0-0_0 line of PH3
was detected in IRC +10216 and CRL 2688 and marginally in VY
CMa for the first time. The PH3 line in IRC +10216 show a composite profile: normal broad line (FWHM=28
km/s) with a narrow component (FWHM=4 km/s) at the center. If both
components are thermal lines, the abundances of PH3 are 5x10^-8 in a region with r<150 R* and ~5x10^-7 in a region with r< 8 R*. (from
Tenenbaum & Ziurys, 2008ApJ...680L.121T)
|
|
 | NH3 (click to (un)fold contents)
 |
Effelsberg telescope (beam size of 40" at
23.7GHz) observation of NH3 (1,1) and (2,2) resulted in Tex = 133/FWHM^0.7 K and column density of 4.2x10^13 cm^-2. (from Nguyen-Q-Rieu et al., 1984A&A...138L...5N)
|
 |
Odin detection of ortho-H2O 1_10-1_01 at 557 GHz and the first detection of ground level rotation line of
ortho-NH3 1_0-0_0 at 572 GHz were reported. It confirmed the SWAS detection of the same ortho-H2O line.
Abundances of ortho-H2O/H2 = 2.4x10^-6 and ortho-NH3/H2 = 1x10^-6 were derived.
(from Hasegawa et al., 2006ApJ...637..791H)
|
|
 | CH2CHCN (click to (un)fold contents)
 |
Detection of new species in the CSE of CW Leo: CH2CHCN, CH2CN, H2CS, CH3CCH and C3O
using IRAM 30m and ARO 12M telescopes. The abundances can be interpreted by gas phase chemistry
in the outer CSE. (from Agundez et al., 2007Ap&SS.tmp..247A)
|
|
 | CH2CN (click to (un)fold contents)
 |
Detection of new species in the CSE of CW Leo: CH2CHCN,
CH2CN, H2CS, CH3CCH and C3O using IRAM 30m and ARO 12M telescopes. The abundances can be interpreted by gas phase chemistry
in the outer CSE. (from Agundez et al., 2007Ap&SS.tmp..247A)
|
|
 | CH3CCH (click to (un)fold contents)
 |
Detection of new species in the CSE of CW Leo: CH2CHCN, CH2CN, H2CS,
CH3CCH and C3O using IRAM 30m and ARO 12M telescopes. The abundances can be interpreted by gas phase chemistry
in the outer CSE. (from Agundez et al., 2007Ap&SS.tmp..247A)
|
|
 |
CS (click to (un)fold contents)
 | One line C33S,J=2-1
around 97 GHz were detected in the first run of IRAM 30m telescope
during May 1985. (from Lucas et al., 1986A&A...154L..12L)
|
 |
NRAO 12m telescope detected CS
v=1 and v=0,J=5-4 lines from CW Leo. CS rotational lines are excited by
absorption of 8um photons from dust and so CS lines are obviously varying with time. Abundance at the center were
derived to be 2x10^-6 for v=0 state and 1x10^-7 for v=1 state. (from Turner, 1987A&A...182L..15T)
|
 | The JCMT single dish (beam size 15") mapping of CS,J=7-6 showed a FWHM size of 23", so a
Gaussian source size can be derived as 17.4". The maximum brightness temperature at
the source center was about 38 K, lower than that of HCN (53 K), which
was thought to be because CO is collisionally excited while HCN is
mainly radiatively excited.
(from Williams and White, 1992A&A...266..365W)
|
 |
CS,J=7-6 was observed
using CSO (10.4m). (from Wang et al., 1994ApJS...95..503W)
|
 | PdBI + IRAM 30m single dish mapped CS,J=2-1, SiS,J=5-4, CN,N=1-0
and SiCC,4(2,3)-2(2,2), found incomplete ring like distribution of CN and SiCC. The CN
ring show an axis along PA of 20 degree. The FWHM source size of CS,J=2-1 measured from the contour map was 7",
then with the beam size of 3.6", a gaussian source size can derived
as 6". A clumpy ring at radius of
15" can be seen.(from Lucas et al., 1995Ap&SS.224..293)
(Figure: maps of molecules.)

|
 |
Polarization of 1% was detected in CS, J=2-1 towards CW Leo. It could be caused by the
non-sphericity of the CSE. PA of the polarization is -70 deg, roughly perpendicular to the
elongation of the CSE. In another star CRL 2688, 5.1(+-1.5)% (1 sigma) and <0.9% (3 sigma)
was found for CS and HCN respectively. (from Glenn et al., 1997ApJ...487L..89G)
|
 |
The vibrationally excited transitions of CS,v=1,(J=2-1, 3-2, 5-4, 6-5, 7-6) have been
detected towards CW Leo. All lines show narrow
line width (~ 10km/s), and so should originate from the dust formtion
region. The J=3-2 was particularly narrow
(1~2 km/s) and could be a weak maser line.
The narrow line widths indicate a source size of <0.5".
The column density in v=1 state was (2-6)x10^16
cm^-2 (very uncertain because points
on rotation diagram were on a curve, instead of a straight line!).(from Highberger et al., 2000ApJ...544..881H)
|
 |
SMA observation of CS,J=14-13.
The 680 GHz continuum emission mainly comes
from photosphere, with a peak flux of 3.8
Jy agree well with previous observation at 89 and 242 GHz according to Snu ~ nu^2 for optically thick emission. CS
showed a centrally peak image in the map
with 2" resolution, but didn't show the
15" ring structure found by previous observation of J=2-1
line. The measured diameter on the Vsys map is 2.5", with beam of 2", a
Gaussian source size is 1.5". (from Young et al., 2004ApJ...616L..51Y)
|
|
 |
C2S (click to (un)fold contents)
 |
With an assumed source size of 25", IRAM 30m
observation gave Trot(C2S) = 14+-3 K, N = 1.5 x 10^14 cm^-2.
The column density of both C2S and C3S is 20-80 times lower than CS.
This means a new carbon chain series CnS
had been detected, in addition to other 3 known chains: H(CC)nCN,
CnH, CnN. (from Cernicharo et al., 1987A&A...181L...9C)
|
|
 |
C3S (click to (un)fold contents)
 |
With an assumed source size of 25", IRAM 30m
observation gave Trot(C3S) = 28+-4 K, N = 1.1 x 10^14 cm^-2.
The column density of both C2S and C3S is 20-80 times lower than CS.
This means a new carbon chain series CnS
had been detected, in addition to other 3 known chains: H(CC)nCN,
CnH, CnN. (from Cernicharo et al., 1987A&A...181L...9C)
|
 |
The C3S, J=4-3 was detected using NRAO 40 foot (43m)
telescope. The rotation diagram of C3S show two
components with Trot = 17 K and 47 K respectively. The column density was 6.7x10^13 cm^-2. A plot of HC(2n+1)N, C(n)S, C(n)
was given to show the decreasing trends of column density with
increasing number of atoms. (from Bell et al., 1993ApJ...417L..37B)
(figure: left -- rotation
diagram C3S and C5S; right -- decreasing column density with number of atoms in
species.)
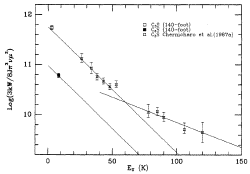 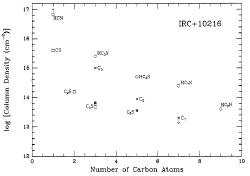
|
|
 | H2CS (click to (un)fold contents)
 |
Detection of new species in the CSE of CW Leo: CH2CHCN, CH2CN,
H2CS, CH3CCH and C3O using IRAM 30m and ARO 12M telescopes. The abundances can be interpreted by gas phase chemistry
in the outer CSE. (from Agundez et al., 2008A&A...479..493A)
|
|
 |
SiC (click to (un)fold contents)
 |
IRAM 30m telescope measurement of
SiC J=4-3, 6-5 by Cernicharo et al., 1989ApJ...341L..25C
gave NSiC = 6x1013 cm-2
using a source
diameter of 30". They mentioned that the Tex might be different within
and between Omega ladders. (from Cernicharo et al., 1986A&A...167L...9C)
|
 |
The mm spectral of SiC radical in its
3PI ground state was discussed and detected in CW Leo for the first time.
The source diameter of the detected emission is larger than 54".
(from Cernicharo et al., 1989ApJ...341L..25C)
|
|
 |
SiCC (click to (un)fold contents)
 |
Nine of previously unidentified lines were
identified to the first radical ring molecule SiCC.
(from Thaddeus et al., 1984ApJ...283L..45T)
|
 |
The first detection of cm line of SiCC:
1(1,0)-0(0,0) was reported. (from Snyder et al., 1985ApJ...290L..29S)
(figure: the rotation diagram)

|
 |
IRAM 30m detected lines from 29SiCC and
30SiCC and their spectroscopic
parameters were calculated. Isotopic ratios had been
determined: 28Si/29Si =
19.0+-1.5, 28Si/30Si =
30.7+-2.3, 29Si/30Si =
1.44+-0.15. (from Cernicharo et al., 1986A&A...167L...9C)
|
 | One line SiCC,4(2,2)-3(2,1)
around 95 GHz were detected in the first run of IRAM 30m telescope
during May 1985. (from Lucas et al., 1986A&A...154L..12L)
|
 |
Astronomical and laboratory study of Si13CC. (from Cernicharo et al., 1991A&A...246..213C)
|
 |
Nobeyama Millimeter Array observation of SiCC,4(0,4)-3(0,3)
show an incomplete shell structure with a
diameter of 30". Chemistry
calculations showed that SiCC is mainly produced in the shell region by ion-molecule
reactions.(from Takano et al., 1992PASJ...44..469T)
(figures: left
-- channel maps of SiCC; right
-- Vsys map between -22.7 and -31.7 km/s)
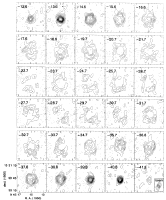 _ _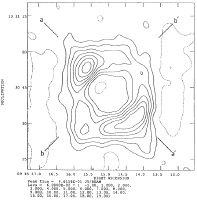
|
 |
Use BIMA mapped SiCC 42,2-32,1 at 95.57936 GHz.
The emission ragion is an asymmetric shell with rough radius of 14".
VLRS = -23.8 km/s. (from Gensheimer et al.,
1992ApJ...388L..31G)
|
 | PdBI + IRAM 30m single dish mapped CS,J=2-1, SiS,J=5-4, CN,N=1-0
and SiCC,4(2,3)-2(2,2), found incomplete ring like distribution of CN and SiCC. The CN
ring show an axis along PA of 20 degree. The ring size of SiCC measured from the contour map was 27". There is also a central
component in the SiCC map. (from Lucas et al., 1995Ap&SS.224..293L)
(Figure: maps of molecules.)

|
 | BIMA mapping was combined with NRAO 12M single dish
data to show that SiCC,4(2,2)-3(2,1) in CW
Leo show a shell-like distribution. (They
adopted a distance of 290 pc.) The
SiCC emission is distributed in a shell with inner and outer radius of
~2x10^16 cm (4.6") and ~6x10^16 cm (13.8"). Abundance is SiCC/H2
= 1.4x10^-6. (from Gensheimer et al., 1995ApJ...439..445G)
(figure: The conbined channel maps
showing shell structure with bipolar symmetry.)

|
 | Tentative detection of 5 rotational lines from SiCC,nu3=1
state was reported. The abundance ratio N(nu3=1)/N(nu3=0) <
0.024.
(from Gensheimer & Shyder, 1997ApJ...490..819G)
|
|
 |
SiC3 (click to (un)fold contents)
 | Seven rotational lines of the planar and highly
polar ring molecule SiC3 were detected in CW Leo using the ARO 12M
telescope. Assuming a shell with diameter of 40", the column
density was found to be 4.3x10^12 cm^-2. Rotational temperature is about
10-20 K within K-ladders and 50 K across K-ladders, similar as SiCC. (from
Apponi et al., 1999ApJ...516L.103A)
(figure: the rotation diagram of SiC3)
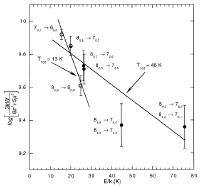
|
|
 |
SiS (click to (un)fold contents)
 | SiS J=6-5 and 5-4
lines are detected for the first time in CW Leo using the NRAO 36-foot 11m telescope. Also detected is the
SiO,J=2-1 line. (from Morris et al., 1975ApJ...199L..47M)
|
 | The SiS, v=0, J=1-0 and 2-1 lines were detected in CW Leo. The blue peak of J=1-0 line is too strong than prediction and
maser emission is suspected. (from Grasshoff et al.,
1981A&A...101..238G)
|
 | Onsala 20m telescope (FHPBM = 41"-52")
mapping of SiS,J=5-4 gave deconvolved
gaussian source diameters of 20"-19".
The derived abundance is SiS/H2 = 2.8x10^-6.
An isotopic ratio was derived as 28Si/29Si = 16+-3
(1 sigma).(from Olofsson et al., 1982A&A...107..128O)
|
 | The SiS, J=1-0 maser was found in CW Leo. The maser appear at the
blue edge of the broad thermal line and the
intensity increase with higher spectral resolution. (from Henkel et al.,
1983ApJ...267..184H)
(Figure: line profile of the mm SiS maser)
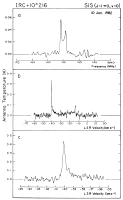
|
 | Multiple transitions of SiS
were observed in CW Leo and modelled. IR
excitation in inner CSE and photodissociation
in the outer CSE are necessary to get good fit. The excitation model of
SiS lines predicts time variation. SiS,
J=1-0 was found to be maser. The column
density is SiS/H2 = 2.4x10^-7. Worse fit of
several lines could be explained by IR line
overlap with HCN and C2H2. The abundance of CS and SiS in several
C stars demonstrated that Si atoms could be
all condensed into SiC dust grains while S atoms are not. (from Sahai et al., 1984ApJ...284..144S)
|
 | 29SiS,J=5-4 and 30SiS,J=5-4
were detected in the first run of IRAM 30m telescope during May 1985. An
isotopic ratio of 29Si/30Si = 2.1+-0.5
was derived. (from Lucas et al., 1986A&A...154L..12L)
|
 |
NRAO 12m telescope observed SiS,v=1,J=12-11,
13-12, 14-13 of CW Leo. All lines are narrower than 29 km/s, and
so solely arise from the acceleration zone (smaller than 8 stellar
radii, say, r < 1x10^15 cm). The lines are consistent with high
excitation temperature > 600 K, but maser
action is also possible. (from Turner, 1987A&A...183L..23T)
|
 |
Model fitting of BIMA mapping and other single dish data showed that the SiS abundance is
SiS/H2 = 7.5x10^-6 within a radius of 3x10^15
cm, but falls to 6.5x10^-7 beyond that. SiS begins to be photodissociated beyond r=4x10^16
cm and there is a cut off at 8x10^16 cm.
From their maps, the directly measured source diameter is 21" for SiS,5-4, so deconvolution with the beam size of
8" gives FWHM = 19". For SiS,6-5, the map give a diameter = 20",
deconvolusion with a beam size of 13" gives FWHM = 15".(from Bieging
& NGuyen-Quang-Rieu, 1989ApJ...343L..25B)
|
 |
SiS size = 14" (from Kahane et al., 1987,
A&A, inpress)
|
 |
BIMA interferometer mapping of SiS,J=6-5
showed that it has a centrally peaked brightness distribution with FWHM
source diameter of 16". Modeling
showed that the SiS gas abundance must has dropped drastically when it
flow out beyond a radius of ~ 2x10^15 cm. (from Bieging & Taffala, 1993AJ....105..576B)
(figure: left -- SiS
channel maps; right -- integrated Vlsr SiS map)
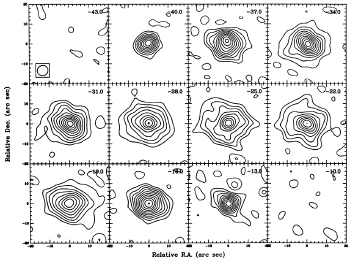 _ _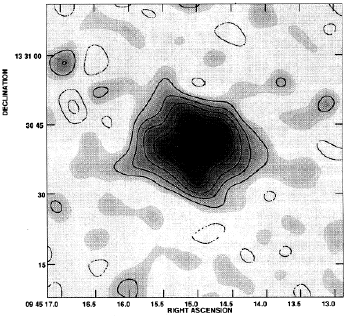
|
 | PdBI + IRAM 30m single dish mapped CS,J=2-1, SiS,J=5-4, CN,N=1-0
and SiCC,4(2,3)-2(2,2), found incomplete ring like distribution of CN and SiCC. The CN
ring show an axis along PA of 20 degree. The FWHM source size of SiS measured from the contour map was 6.7". (from Lucas et al., 1995Ap&SS.224..293)
(Figure: maps of molecules.)

|
 | The SiS,v=1,J=13-12
line was resolved by PdBI and a source size of 0.4"
(7x10^14 cm, 10 stellar radii) was derived. (from Lucas, 1997Ap&SS.251..247L)
|
 | Maser lines were found
in the SiS,v=0, J=11-10, 14-13, 15-14 line
profiles towards CW Leo for the first time. These lines and maser could
be pumped by IR line overlap with C2H2 and
HCN in the inner CSE. Large number of other IR line overlaps indicates
that maser action could be found in other higher transitions of SiS and
even in isotopologues of SiS. (from Fonfria-Exposito et al., 2006ApJ...646L.127F)
(figure: maser and relatied line
profiles and possible line overlaps.)
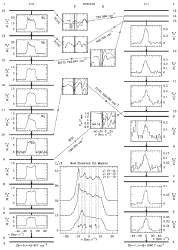
|
|
 |
SiO (click to (un)fold contents)
 | SiS J=6-5 and 5-4
lines are detected for the first time in CW Leo using the NRAO 36-foot 11m telescope. Also detected is the
SiO,J=2-1 line. (from Morris et al., 1975ApJ...199L..47M)
|
 | Onsala 20m telescope (FHPBM = 41"-52")
mapping of SiO,J=2-1 gave deconvolved
gaussian source diameters of <20".
The derived abundance is SiO/H2 = (1.1-2.7)x10^-7.
(from Olofsson et al., 1982A&A...107..128O)
|
 | SiO,v=0,J=2-1 was mapped using BdBI in CW Leo, S star Chi Cyg and 10 M stars.
The size of SiO emission region is of a diameter of about 20"
in CW Leo. But the SiO lines in other stars seem to be from a region without outflow velocity (size doesn't change with velocity).
(from Locus et al., 1992A&A...262..491L)
|
 | SiO,J=5-4,8-7 and HCN,J=3-2,4-3 were detected towards CW Leo and other M, S, C type AGB stars.
V Cyg was found to show possible maser emission in HCN,(0,1^1c,0),J=3-2,4-3 lines. HCN in M stars
is suggested to be produced in the central region by shock
chemistry. HCN/SiO ratio increases with increasing mass loss rate for M and S stars.
(from Bieging et al., 2000ApJ...543..897B)
|
 | SMA mapping of SiO, J=5-4 and multitransition by single dish in CW Leo showed
that the abundance SiO/H2 = 1.5x10^-6 in the
inner part of the CSE (3-8 R*), one order of magnitude higher than predicted from equillibrium photosphere chemistry.
In addition to the compact component, a more extended region (r~2.4x10^16 cm)
with lower abundance (1.7x10^-7) is necessary to fit the data.
(from Schoier et al., 2006ApJ...649..965S)
|
 | Multiple transitions of SiO observed in CW Leo and other C stars showed that the abundence
of SiO in these C stars can be several orders of magnitude higher than predictions from
equillibrium stellar chemistry. This could be explained by shock chemistry and dust formation.
The measured diameter on the map is 6", with the beam size of 2.6", a
Gaussian source size = 5.4".
(from Schoier et al., 2006A&A...454..247S)
|
|
 |
SiN (click to (un)fold contents)
 | Five transitions of the first extraterrestrial
silicon-nitrogen molecule SiN were detected
in the outer CSE of CW Leo. The column density was N
= 3.8x10^13 cm^-2. (from Turner, 1992ApJ...388L..35T)
|
|
 |
SiCN/SiNC (click to (un)fold contents)
 |
The detection of SiCN
lines in the ground fine structure state 2PI1/2 (each line with lambda
doubling) by IRAM 30m were reported. The U-shaped line profile
indicating a shell like pattern. The abundance was estimated to be SiCN/H2 = 4x10^-9, which is 20 time lower than
MgNC. (from Guelin et al., 1993A&A...280L..19G)
|
 |
Detection of SiCN in CW Leo by IRAM 30m telescope was reported. The abundance is estimated to be
SiCN/H2 = 4x10^-9, about 20 times lower than that of MgNC.
(from Guelin et al., 2000A&A...363L...9G)
|
 |
SiNC and SiCN lines were detected by IRAM 30m in CW Leo.
The excitation temperature for 15-30 K for SiCN
and ~18 K for SiNC. The column density of
SiNC is 2x10^12 cm^-2, similar to that of
SiCN. Possible ways to make SiNC/SiCN are
(1) neutral gas reaction:
Si + HCN => SiCN + H
Si + HCN => SiNC + H
(2) grain surface chemistry: reaction of Si with HCN on Si substrate can
efficently produce both SiCN and SiNC at a low temperature of 12K. (from
Guelin et al., 2004A&A...426L..49G)
|
|
 |
H2CO (click to (un)fold contents)
 |
IRAM 30m detected H2CO lines in CW Leo for the first time. The abundance was
H2CO/H2 = 1.3(+1.5-0.8) x10^-8 and H2CO/H2O = 1.1+-0.2x10^-2, in accord with formaldehyde abundance in solar
comets. But H2CO in CW Leo could be produced by either comets or photochemistry in the outer envelope, because the source size of H2CO
was found to be extended by preliminary mapping. (from Ford et al., 2004ApJ...614..990F)
|
|
 |
H2O (click to (un)fold contents)
 |
Odin detection of ortho-H2O 1_10-1_01 at 557 GHz and the first detection of ground level rotation line of
ortho-NH3 1_0-0_0 at 572 GHz were reported. It confirmed the SWAS detection of the same ortho-H2O line.
Abundances of ortho-H2O/H2 = 2.4x10^-6 and ortho-NH3/H2 = 1x10^-6 were derived.
(from Hasegawa et al., 2006ApJ...637..791H)
|
|
 |
C3O (click to (un)fold contents)
 | ARO 12m and IRAM 30m observations detected C3O lines in CW Leo for the first time.
The U-shaped line profile indicating extended distribution of C3O in a
shell. The total column density was N(C3O) =
1.2x10^12 cm^-2. Model predicts that C3O shell has a ourter radius of ~ 30". (from Ford et al., 2004ApJ...614..990F)
|
 |
Detection of new species in the CSE of CW Leo: CH2CHCN, CH2CN, H2CS, CH3CCH and
C3O using IRAM 30m and ARO 12M telescopes. The abundances can be interpreted by gas phase chemistry
in the outer CSE. (from Agundez et al., 2007Ap&SS.tmp..247A)
|
|

mm masers (go to top)
 |
177 GHz HCN nu2=1,J=2-1 maser (Lucas &
Cernicharo 1989, A&A 218, L20) show a factor of 2 intensity variation with
time. (Cernicharo
et al., 2000, A&AS 142, 181). |
 |
IRAM PdBI interferometer mapping of HCN,(0,2^0,0),J=1-0
line in CW Leo in May 1991 didn't significantly resolve it. The lower limit
of brightness temperature of the line was 2000K, indicating a weak maser
action. (from Lucas & Guilloteau, 1992A&A...259L..23L) |
 |
The possible maser line HCN,(0,2^0,0),J=1-0
around 89 GHz were detected in the first run of IRAM 30m telescope during
May 1985. (from Lucas et al., 1986A&A...154L..12L) |

Chemistry (go to top)
 |
Assuming a constant isotropic mass loss rate and a
'standard' ISRF (Interstellar radiation field) model, Olofsson et al., 1993
gave a formula between CO photodissociation radius Rph and mass loss rate
Mmlr:
Rph = 4 1016 (Mmlr / 10-6)0.6
(Vexp/15)-0.5 (x(CO)/3 10-4)0.5 cm
|
 |
Some molecular species distribute in a hollow shell of
~15 arcsec radius, e.g., SiC, SiC2, MgNC and carbon chains; others are
confined to inner envelope of radius <6 arcsec.
|
 |
Isotopic ratios were
determined from observed line ratios: 12C/13C =
40(+18,-10), 32S/34S = 22+-4. (from Wannier & Linke, 1978ApJ...225..130W)
|
 |
C, N, S, Si isotopic ratios.
(Kahane et al., 1988A&A...190..167K)
(click to (un)fold contents)
 |
Line observations using IRAM 30m telescope during
Oct. 1985 to May 1987. Tmb = TA*/0.6.
|
 |
C33S, Si33S
and HN13C are first detected in IRC +10216.
|
 |
Only optically thin lines (showing U-shaped profile
or round-topped profile but weak) can be used to calculate isotopic
ratio.
|
 |
Three effects that make line intensity raio different
from isotopic abundance ratio:
 |
different isotopic abundance causes different
opacity and so different infrared excitation.
IR variation should be considered for radiatively excited species as
well.
|
 |
different line strength of different isotopic
species introduces a factor proportional to nu2
to the line intensity. This effect usually produces a change of
5-6%, and can be as high as 8%.
|
 |
different beam dilution
factor due to the change of beam size with frequency
introduce an uncertainty of about 3% to the line intensity ratio.
|
|
 |
Isotope ratios:
-- 28Si/29Si =
18.7(+1.3,-1.0) (terrestrial: 19.6) using SiS J=5-4, SiCC.
-- 28Si/30Si =
28.6(+1.8,-1.5) (terrestrial: 29.8) using SiS J=5-4, SiCC.
-- 29Si/30Si =
1.47(+0.11,-0.09) (terrestrial: 1.52) using SiS J=5-4,8-7, SiCC, SiO.
-- 32S/34S =
20.2(+2.6,-2.1) (terrestrial: 22.5) using SiS J=5-4.
-- 32S/33S =
100(+23,-16) (terrestrial: 125 ) using SiS J=5-4,8-7.
-- 34S/33S =
5.7(+0.8,-0.6) (terrestrial: 5.5) using SiS J=5-4,8-7, CS J=2-1.
-- 12C/13C = 47(+6,-5)
(terrestrial: 89) using C34S/13CS
J=2-1,3-2 with above 32S/34S value
-- 14N/15N > 4400
(terrestrial: 277) using H13CN/HC15N
|
 |
CO, CS and HC3N main isotopic lines are optically
thick and can not be used to constrain 12C/13C
ratio. The most accurate way is using double isotopic line ratio C34S/13CS,
other usuable optically thin lines are: CCH/C13CH, HNC/HN13C,
SiCC/Si13CC.
|
 |
The fact that CCH/C13CH, HNC/HN13C,
SiCC/Si13CC give similar 12C/13C ratio
as C34S/13CS demonstrated that isotopic fractionation is not important for 13C
in IRC+10216.
|
 |
13C is enriched by a
factor of 2 and 15N supressed by at least a factor of 15
w.r.t. solar abundance. This is strong evidance for processed material.
All other isotopes are near to solar ratios.
|
|
 |
Oxygen isotope puzzle: paper 1
(Penzias A. A., 1981ApJ...249..518P)
(click to (un)fold contents)
 |
CO spectra observations of giant molecular clouds by
7 m Crawford-Hill radio telescope during winter and spring of 1979 and
1980 April-May.
|
 | 18O/17O
= 3.65+-0.15 for Galatic disk, 3.5+-0.2 for Galactic center. (uniform in the whole Galaxy within ~5% variation)
16O/18O =
675+-200 for Galactic disk, 250+-100 for Galactic center. (18O enhanced towards GC)
16O/17O = 2460+-750
for Galactic disk, 890+-370 for Galactic center. (17O
enhanced towards GC)
18O/17O = 0.33+-0.1
for IRC+10216 (Solar: 5.5) (10 times lower than
disk! Solar 40% higher than disk!)
16O/18O =
915(+520-380) for IRC+10216 (Solar: 500) (18O is
only slight diminished)
16O/17O =
302(+140-80) for IRC+10216 (Solar: 2750) (17O is
strongly enhanced!)
|
 |
The combined ratio [13CO/C18O]*[C18O/13C18O]
was used to constrain 16O/18O ratio, where 13CO
and C18O lines are strong enough to compare only a restricted
velocity region to avoid opacity effect while C18O and 13C18O
are compared in the whole velocity range. The velocity range for 13CO/C18O
is determined by checking CO/13CO line ratio at different
velocities, say, only in the velocity range where CO is strong w.r.t. 13CO,
13CO/C18O could be free of opacity effect.
|
 |
The interstellar enhancement of 18O/16O
towards GC controdicts with the idea that it is mainly produced by by
equillibrium hydrogen buring CNO cycle in red giants in which 18O
has very low abundance due to nuclear reactions (see below).
|
 |
The interstellar enhancement of 17O/16O towards GC
may reflect the distribution of stellar populations.
|
 |
Uniform spatial distribution of 18O/17O
indicates that the slight destruction of 18O in red giants
has little effect to interstellar 18O.
|
 |
The 40% higher 18O/17O remains
to be an enigma due to large uncertainty in
the data.
|
 |
18O is
produced by 14N(alpha, gamma)18F followed by beta+
decay in the hydrogen burning CNO tri-cycle, but only mantain a low
equilibrium abundance due to the reaction 18O(p,alpha)15N.
It can be produced in low temperature regions only, because it will be
rapidly destroyed by the reaction 18O(alpha, gamma)22Ne
when the temperature exceeds ~108 K. Therefore, 18O
should be mainly produced in the core of stars with M < 2Msun
or in red giants, whereas supernovae are not major contributors to the
interstellar 18O.
|
 |
17O is
produced by both equilibrium and non-equilibrium hydrogen burning.
|
|
 |
Oxygen isotope puzzle: paper 2
(Kahane et al., 1992A&A...256..235K)
(click to (un)fold contents)
 |
IRAM 30m telescope line observations of 12CO,
13CO, C17O, C18O during August of 1988.
Tmb = TA* / eta (eta = 0.60 around 115 GHz, 0.45 around 230 GHz)
|
 | Typical circumstellar
envelope line shapes:
round top -- optically thick and
unresolved;
flat top -- optically thin and
unresolved or optically thick but resolved;
double peaks -- optically thin and resolved.
The optical thickness effect can be appraised by comparing
the line intensities channel by channel, because the optical
thickness increase from line center channels to line edge channels.
|
 | Isotopic fractionation happens in the outer
envelope where the temperature is low (<35K) and selective
photodissociation also happens in the outer envelope where the optical
depth is low.
|
 | chemical fractionation of 13C:
13C+ + 12CO -> 12C+
+ 13CO favors the formation of 13CO for
temperature below 35K. (Watson et al., 1976ApJ...205L.165W)
Another consequency is the increase of C+ abundance towards
outer layer of the circumstellar envelope.
|
 | Determined isotope ratio: (12C/13C
= 44+-3 from literature is used to help determine...)
16O/17O =
840(+230-170)
16O/18O =
1260(+315-240)
17O/18O =
1.47(+0.33-0.25)
|
 | Evolutionary effects on C
and O isotope ratios:
-- Initial solar
abundances:
12C/13C
= 89
16O/17O
= 2750
16O/18O
= 500
18O/17O
= 5.5
-- The first
dredge-up when a star ascendes RGB brings up H-burning products:
12C/13C
drops to 20-30;
16O/17O
slightly reduced for low mass stars, but can decrease to values as low
as 100 for intermediate mass stars (1.4Msun < M < 3.4Msun).
16O/18O
increases less dramatically (to value of 600-1000, depending on star
mass)
17O/18O
increases significantly (depending on star mass)
-- The second
dredge-up during the formation of C and O core after He core burning in
a massive stars (M > 4 Msun) has little effect on C and O isotope
ratios.
-- The third
dredge-up during thermal pulses in AGB stage brings up CO core material
to surface (less 16O than 12C). H shell burning that takes place between
thermal pulses in massive stars converts some 12C into 13C. Therefore,
in the star surface:
12C/16O
increases
12C/13C
increases
16O/18O
may increase
16O/17O
may increase
17O/18O
only slightly changed
|
 |
Observed 12C/13C ratios
agree with above evolution theory: it's smaller than solar value but
larger in C stars than in O-rich stars. (13C enriched in first
dredge-up, but diminishes a little during the third dredge-up.)
|
 |
Observed 17O/18O ratios
agree with above evolution theory: 17O is enriched w.r.t. 18O in all
five carbon rich stars (by a factor of 2-15). (17O significantly
enriched during the first dredge-up and doesn't change any more.)
|
 |
Observed 16O/17O is
small (agree with first dredge-up) but too small w.r.t. other Carbon and
S stars.
|
 |
(More similar observation of O rich stars indicates O
rich stars have 17O/18O <= 0.4, agree with ISM value, and so may be a
major provider of interstellar 17O and 18O.)
|
 |
|
|

Chemistry model (go to top)
 |
A photodissociation model of H2 in CSE including H2 self-shielding was considered.
One of the most important parameter is the H/H2 ratio which is frozen out from the upper atmosphere of the star. It was found that
for stars with T* > 2500K, the outflowing hydrogen
is mainly atomic, while for cooler stars, it is substantially
molecular. For the cooler stars, photodissociation of H2 and heavier molecules contribute to the atomic H in the outer CSE.
The model predicted that H atom should be almost undetectable in CW
Leo. (form Glassgold & Huggins, 1983MNRAS.203..517G) |
 |
A photochemistry model was
discussed to produce CN and C2H radicals by UV photon dissociation of C2H2 and
HCN in the CSE of CW Leo. The CN lines can be better reproduced by
photochemistry. (from Huggins et al., 1984ApJ...279..284H)
(Figure: abundance of CN in their standard
model with shielding (curve S) and that in models with 1/3 or 3 times of
shielding (curves S/3 and Sx3 respectively). X0(HCN) marks the initial
abundance of parent species, while a horizontal line C marks the level of
arbitrarily constant abundance of CN needed to fit observed line
intensities.)
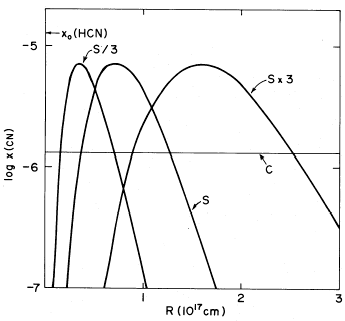 |
 |
Detailed chemistry calculation showed that the recently detected C3H can be produced through ion-molecule reactions that is driven by ions C+ from photodissociation
of carbon rich parent species such as CO, C2H2, HCN in the CSE of CW Leo
(Note that in interstellar clouds, ion-molecule reactions are usually driven
by cosmic ray ionization of H2 and ions like HCO+ and N2H+). But
ion-molecule reaction is not effcient enough to produce observed abundance
of C3N and HC3N in the outflow. (from Nejad et al., 1984A&A...134..129N)
(Figure: Abundances relative to total carbon
abundance which is about [C/H2] = 4.48x10^-4 from their Tab. 1.)
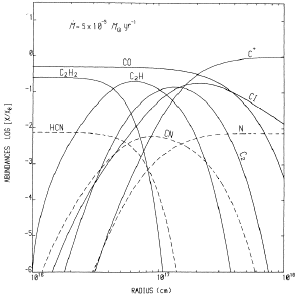 _ _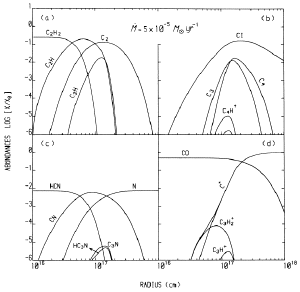 |
 |
A chemistry model was developed to account for the chemistry and heat balance of dense (10^3-10^6 cm^-3)
neutral gas illuminated by FUV (6-13.6 eV)
fluxes 10^3-10^6 times stronger than typical
interstellar field. A standard model of H II
region surface was derived and can be generalized to other objects
such as PN, reflection nebulae, ragions around protostars and galatic
center. (from Tielens & Hollenbach, 1985ApJ...291..722T) |
 |
A model of ionization of C-rich CSE was developed. Ion-molecule reactions were found to be the most important
reactions in the cool outer part of C-rich CSEs. The main involved
ions are produced in two ways: cosmic ray ionization of H2 produces H3+; photoionization of
acetylene (C2H2) and C atoms (produced in the
photochains of CO, C2H2, HCN, etc.) produces C2H2+
and C+. These primary ions react
with neutral molecules to produce heavier ion molecules such as H3+, HCO+,
HN2+, C2H3+ and H2CN+ before being destroyed by
dissociative recombinations. The ion may be responsible for various heavy
hydrocarbon molecules observed in CW Leo. (from Glassgold et al., 1986A&A...157...35G)
(Figure: left -- C2H2
chemistry; right -- radial distributions of ions and neutrals where
X3 and X3+ represent all neutrals and ions with 3 atoms, and so on.)
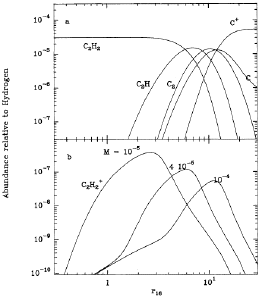 _ _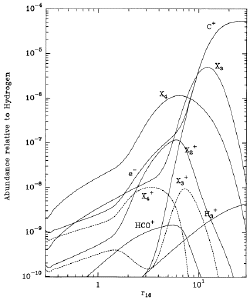 |
 | Previous photochemistry model was
developed to include temperature dependence of
ion-molecule reactions with polar molecules (ion-polar
molecule reaction rates increase with decreasing temperature, when Tk <
300K: rate k(T) = k(300K)*(300/T)^n, with
n=0.65), particularly HCN, and line self-shelding of CO. The
model can well explain the upper limit of HCO+, the large ratio of HCN/HNC
and the H13CN/HNC line temperature ratio. (from Glassgold et al., 1987A&A...180..183G)
(Figure: left -- radial
distributions of various ions (X3+ and X4+ represent all ions with odd and
even number of atoms respectively); right -- radial distributions of HCN photochain.)
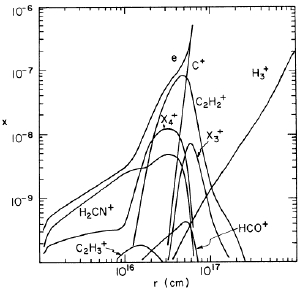 _ _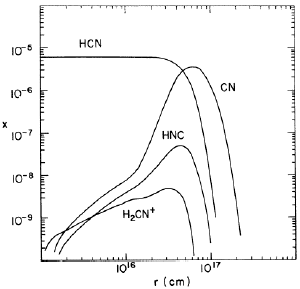 |
 |
A detailed chemistry model for the outer
envelope (10^16-10^17 cm) of CW Leo was present. The chemistry was
driven by cosmic ray and UV
ionization and complex chemistry was found. Ion-molecule
reactions can produce enough hydrocarbon species and can interpret
observed CH3CN and HNC abundances. (from Nejad & Millar, 1987A&A...183..279N)
(Figure: chemical abundance distribution)
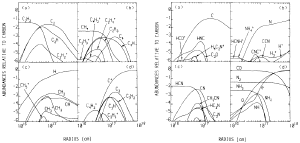 |
 |
In the pathway to form HCN and HNC from radiative decay
of the species H+C+N, the HCN/HNC ratio is
about 20. (from Brown et al., 1989ApJ...347..855B) |
 |
A chemical model for the formation of carbon chain
molecules was considered. Ogano-sulfer species such as
C2S and C3S are formed by ion-molecule
reactions involving CS, SiS and acetylenic ions. Hydrocarbons (C2nH) and cynopolyynes with upto six C
atoms (HC2n+1N,n=1,2,3) and SiCn (n=1-4) are formed by both ion-molecule and neutral-neutral
reactions. One problem in this model: cynopolyynes larger than HC5N
can not be reproduced due to too short time scale in the outflow. (from Howe
& Millar, 1990MNRAS.244..444H) |
 |
A revised chemistry model for CW Leo inludes a reasonable
dust model. A new chemical route to produce
cynopolyynes: reactions of C3N and C5N radical with
acetylene to be efficient. The model can qualitatively reproduce the
observe pattern of HCN, CN, HC3N and C3N. But the calculated column density
of higher order of cynopolyynes is too small. (from Cherchneff et al., 1993ApJ...410..188C)
(Figure: new cyanopolyynes chemistry paths.)
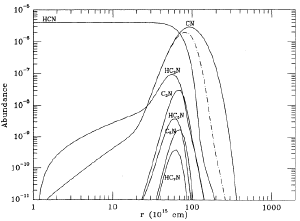 |
 |
The dynamical timescalse of CSE (r/v ~ 1000 yrs) is comparable to the chemical timescale (~1/k/n(X), X is reactant) of
fast neutral gas reactions, therefore photodissociation induced neutral-neutral radical reactions in the outer CSE are possible to produce the observed cynopholyynes and polyacetylene
chains in CW Leo. The reactions are mainly two-body reaction or
two-body radiative associations, because the density in the outer CSE is too low for three-body reactions.
(from Cherchneff & Glassgold, 1993ApJ...419L..41C)
(Figure: left -- chemistry
of cyanopolyynes; right -- chemistry of polyacetylenes.)
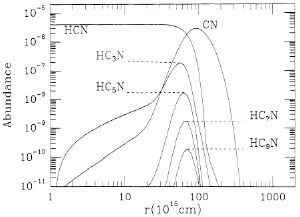 _ _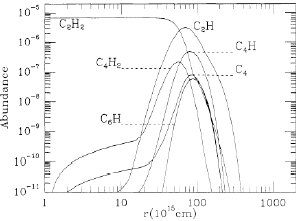 |
 |
A new chemical model for the CSE of
CW Leo was developed to include a variaty of newly measured rapid neutral-neutral reactions
between C atoms
and hydrocarbons and between the radical CN and some stable neutral molecules. This model can produce
enough large hydrocarbon radicals and cynopolyynes to explain observations. Lists of column densities of hydrocarbons and cynopolyynes was given. (from
Millar et al., 1994A&A...288..561M)
(figure: left
-- pathways of hydrocarbon formation; right -- pathways of cynopolyynes formation.)
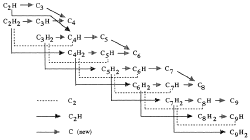 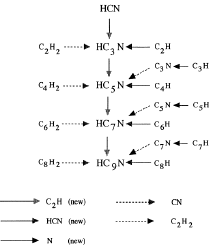 |
 |
A chemical model was presented to
produce metal cyanides by radiative association
of Na+ and Mg+ with cynopolyynes such as HC5N, HC7N. It was concluded that the metal
cyanides should be preferably in the form of T
shaped NaCN and linear
AlNC, instead of the high energy isomers linear
NaCN or AlCN. (from Petrie, 1996MNRAS.282..807P) |
 |
Experiments indicated that atomic C collision reaction can
be a potential pathway to form l-C3H and c-C3H in the outflow of CW Leo. (from Kaiser et al., 1997ApJ...477..982K) |
 |
A dynamical and chemical model was developed for the
inner CSE of CW Leo to include both pulsation-driven
shocks and extended chemical networks (particularly
include hydrocarbon species, Si- and S-bearing species.) The model results agree
with observations quite well. TE abundances were given in their Table 3 while shock chemistry abundances were given in their
Table 4. (from Willacy, K., & Cherchneff, I.
1998A&A...330..676W) |
 | A very detailed chemistry model that inludes gas phase chemistry, photodissociation (particularly CO and H2 self-shelding),
LVG calculation and continuum radiation transfer of dust for the
outer part of CSE was explored to check the necessity
to consider so much details. It was found that those factor affect the penitration of UV field in the CSE is the most important to
affect the chemistry model, e.g., mass loss rate, continuum opacity, line and continuum shielding. The model can satisfactorily
reproduce observed column densities of simple species, particularly atomic carbon
abundance. But the difficulties to reproduce complex species column density indicates more proper chemical networks of them
are needed in the model. A table of column densities for C molecules was given.
(from Doty & Leung, 1998ApJ...502..898D)
(figure: left to right in order -- (1) model result (upper left label for solid line, lower right label for broken
line); (2) effect of mass loss
rate; (3) effect of interstellar
UV radiation field; (4) effect of continuum opacity; (5) effect of gas temperature.)
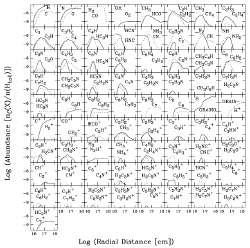 _ _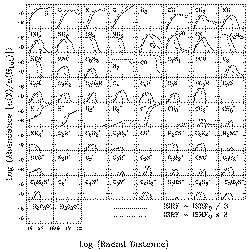 _ _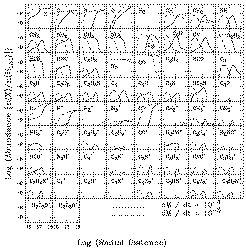
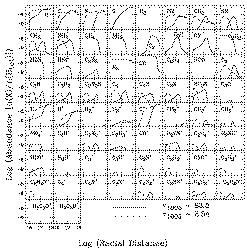 _ _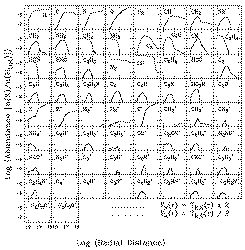 |
 | The circumstellar chemistry of SiC,
SiC2, SiC4, SiH2,
SiH4, HNSi and SiN in the CSE of CW Leo was modelled. SiCC
was thought to be a parent for other reactions. The observed outer ring of SiCC emission distribution can not be reproduced by
the chemistry model of a steady outflow CSE, which indicates that the SiCC ring could be due to density peaks. (from MacKey & Charnley,
1999MNRAS.302..793M)
(Figure: left --
photochemistry of parent molecules; right -- photochemistry of Si-C and Si-N compounds.)
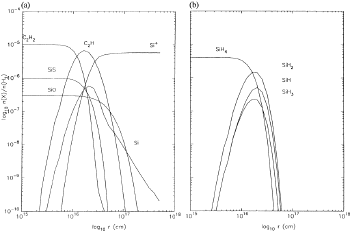 _ _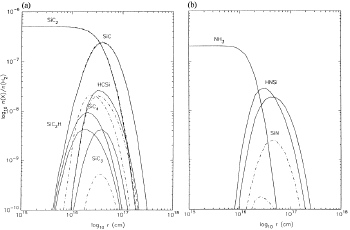 |
 | A new photochemistry model for CW Leo. It includes 3851 reactions and 407
gas-phase species. Carbon containing molecules upto 23 C are
considered. Negative ions Cn-
and CnH- are found to be abundant and maybe detectable at mm. Radial column
densities show log-linear dependence to the molecular sizes. (from Millar et
al., 2000MNRAS.316..195M)
(figure: left -- radial
abundance of cyanopolyynes HC2n+1N versus n; right
-- radial column density of CnH versus n.)
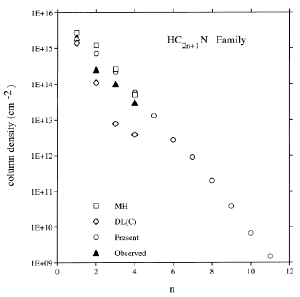 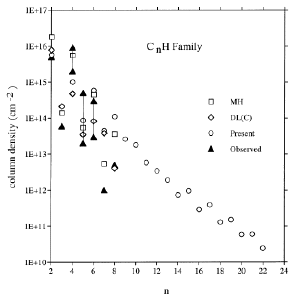 |
 |
With an updated chemical model,
particularly updated S+C2H reaction system, the calculated column density of organo-sulfer species agree
with observations quite well. (from Millar et al., 2001MNRAS.327.1173M)
(Figure: Ogano-sulfur chemistry)
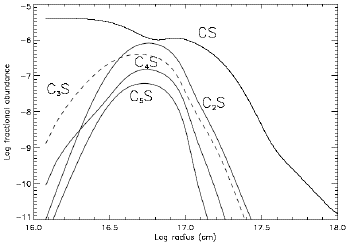 |
 |
The formation of PAHs in the
inner CSE of CW Leo was considered. The amount of C atoms in PAHs or its dimers is much less than that contained in
dust grains. (from Cau, P. 2002A&A...392..203C) |
 |
Ab initio chemistry calculation showed that the fomation
paths of CCN(2PI), CNC(2PIg)
and c-C2N are all endothermic,
and so can not happen in cold interstellar clouds
(Tk = 10-15 K). But they may be able to form in the hot
inner CSE of evolved stars where Tk can reach 4000 K. (from Mebel
& Kaiser, 2002ApJ...564..787M) |
 |
Density enhanced multiple shells are considered in chemistry modelling of
the CSE of CW Leo. The shells will affect the penitration of UV photons in the CSE. The consequence of this effect is
narrowing of molecular abundance
radial distributions. (from Brown & Millar, 2003MNRAS.339.1041B)
(Figure: left -- narrowed
radial distributions of CnH; right -- narrowed radial distributions of CnS.)
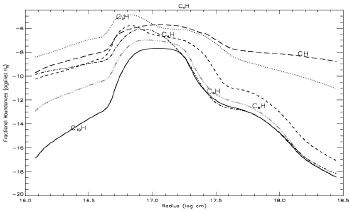 _ _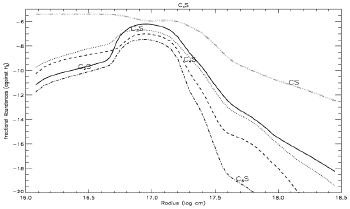 |
 |
Fischer-Tropsch catalysis can
produce large amount of H2O in carbon star like
CW Leo, as long as iron dust is enough in the CSE. (from Willacy, 2004ApJ...600L..87W) |
 |
Icy comets or catalysis reaction on iron grain surfaces were
invoked to explain the detection of oxygen-bearing molecules (H2O, OH, H2CO). Non-LTE chemistry can make H2O and
CO2 from CO only at a radius of about 15 stellar radii. But, this model can
not satisfatorily reporduce all observed line profiles of H2CO, H2O, HCO+,
SO and H2CS. (from Agundez & Cernicharo, 2006ApJ...650..374A) |
 |
They investigated a non-equilibrium chemistry model which includes
different photospheric C/O ratios (from 0.75
to 1.01 while the other elements are kept solar) and periodic shocks induced by stellar pulsation for the
inner CSE (before dust condensation). Photo-dissociation and photo-ionization were not considered because the
stellar UV flux is very low and the post shock ionization is very weak. 68 elements and molecules and 752 reactions
were included in this model. The molecular concentration was determined by solving a system of non-linear, stiff, ordinary, coupled differential equations. As a result,
unexpected molecules appear due to the shock chemistry. Only CO, HCN, CS and SiO were found to be present for all kinds of photospheric C/O ratios. Other species are typical for O-rich and C-rich stars
respectively: for O-rich stars: OH, H2O, CO2, SO, SO2, HS; for C-rich stars:
C2H2, SiS; S stars show sensitive
dependence upon C/O ratios, SE stars are similar to O-rich stars while SC stars are similar to C-rich stars,
but in the case of C/O = 1.0, the star show two shells, with O-rich contents in the inner shell and C-rich
contents in the outer shell. (from Cherchneff, 2006A&A...456.1001C) |
 |
Chemical simulation of O-rich
molecules in CW Leo showed that 1) H2O
and CO2 can maintain a large abundance at radius > 15R* in LTE condition; 2) non-LTE
chemistry is difficult to produce the high LTE abundances of H2O and
CO2; 3) chemical model predicts the presence of HCO+,
SO and H2CS. (from
Agundez & Cernicharo, 2006ApJ...650..374A) |
 |
Chemical model of radiative
electron attachment in ISM and CSE showed that the radiative
attachemnt to hydrocarbon molecules with more than 5 C atoms is very efficent.
As a result, the relative abundances of C6H-, C8H- and
C10H- range from several percents to mroe than unity, compared with
their neutral analogs. Although the relative abundance of C4H- is low, it could be still detectable in CSE due
to the large abundance of neutral C4H. (from Millar et al., 2007ApJ...662L..87M)
(figure: radial distribution of
fractional abundances of carbon chain anions in the model of left -- CW Leo; midel -- TMC-1; right -- The horsehead
nebula.)
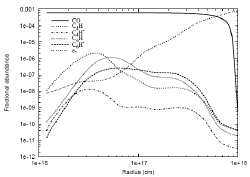 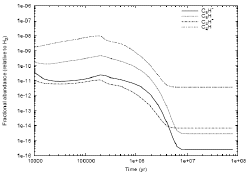 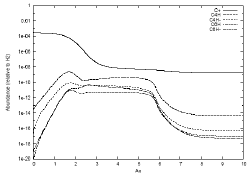
|
 |
Adsorption of radicals onto water ice is studied. While gas phase reaction between
C3N and H2O is difficult, polycyanoacetylene adsorbed on water ice grains can
effectively capture H atom from gaseous H2O to form hydrocyanides such as
HC3N. The adsorption of C2n+1N on water ice can be stabilized in the form of
C2n+1N...(H2O)n complex.(from Xie et al., 2007ApJ...662..758X) |
 |
They improved the chemistry model
for dust shell patterns in CW Leo. The enhance dust density shells shaded out
the interstellar UV photons and thus delay the
photochemistry to larger radii. By assuming tight kinematical coupling between dust and gas, they can produce
narrow peak of C2H, C6H, HC3N and HC5N at
radius of ~15" that agree better with observations (with a distance of 130 pc to CW Leo). However, a predicted broad peak of
C4H at a radius of 8" was not seen in any
previous observations, indicating the need of further investigation. They
also found observable amount of C2H-
and C2n-1N- and and the
production of MgNC in the outer CSE. (from
Cordiner & Millar, 2009arXiv0903.0890M)
(figs: left -- radius
distribution of density and intensity of C2H, C4H and C6H; middle left -- that of HC3N and HC5N and density in a model without
shells; middle right -- that of C4H-, C6H- and C8H-; right --
that of MgNC.)
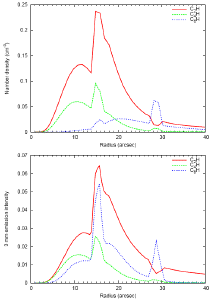 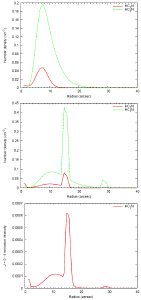 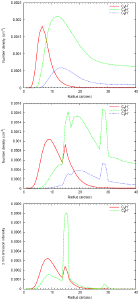 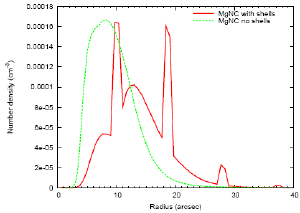
|

Physical
model of CSE (go to top)
 |
A gas temperature model of the CSE of CW Leo was
calculated by considering steady expansion, CO rotational line cooling and
dust drift heating. (Kwan & Hill, 1977ApJ...215..781K) |
 |
LVG model and thermal
balance calculation (including adiabatic cooling,
molecular line cooling and gas-dust collision heating) were calculated and the
model results were compared with single dish mapping of CO,J=1-0 with radio
telescopes with different beam sizes. The best fit model was: dust-gas
momentum transfer efficiency Q = 2.35x10^-2 (+-15%),
CO/H2 = 6x10^-4 (+-30%), mass loss rate
= 4x10^-5 * (d/200pc)^2 Msun/yr (+-40%).
(from Kwan & Linke, 1982ApJ...254..587K) |
 |
By comparing dust opacity between UV and IR, a dust opacity law varying as lambda^-1.3 was found when lambda varies by a factor of 10^3, regardless of
the composition of the dust grains. (my comments: the distance of 290 pc may
not be correct and the chemistry of HCN was unknow that time, so the result could
problematic.) (from Jura, 1983ApJ...267..647J) |
 | A physical model of CW Leo was derived by fitting line profiles of diatomic molecules
SiS, SiO, CO and 13CO with varying radial distribution of gas temperature.In the model, the
dust heating source is assumed to be a central 600K opaque core surrounded
by a 375 K warn dust shell plus a cooler extended dust shell whose temperature distribution is
a free parameter. LVG model was used to produce spectral profiles. The best fit was achieved
with mass loss rate of 2x10^-5 Msun/yr for the inner CSE and
8x10^-5 Msun/yr for outer part at r>50" and a distance of 200
pc. The weaker blue wing of most the asymmetric line profiles were interpreted by
self absorption. The SiS abundance is ~8x10^-6 in the inner CSE whereas it is 15 times weaker beyond 3x10^15 cm,
indicating nonequillibrium chemistry in the CSE.
(from Nguyen-Q-Rieu et al., 1984ApJ...286..276N) |
 | An empirical model of gas
density, temperature and velocity in the CSE of CW Leo was suggested
on the basis of IR CO absorption lines and continuum observation and
radiative transfer simulation. The derived mass loss rate is 2x10^-5 Msun/yr. (from Keady et al., 1988ApJ...326..832K) |
 |
Optical spectroscopy (0.50-0.92um), NIR spectrophotometry (8-13um)
and MIR photometry (1-20um) observations were performed for three carbon stars to compare between
extreme and Mira carbon
stars. Except for the difference in density of the CSE,
no basic difference were found between the two kinds of
carbon stars. The model size of CW Leo is smaller than 0.1" for <1um wavelengths
while observed FWHM = ~ 0.9", indicating possible role of dust scattering. But the scattering
effect is negaligible at 2.2um. The optical images of CW Leo look nonspherical.(from Le Bertre, 1988A&A...203...85L) |
 |
Detection of 1.5cm and 2cm continuum emission from CW Leo
allowed the detemination of dust emission law: F ~ lambda^-1.2.
(from Sahai et al., 1989A&A...220...92S) |
 |
A non-local line overlap radiative
transfer model was developed to discuss excitation of the HCN
hyperfine structure lines. (from Truong-Bach & Nguyen-Q-Rieu, 1989A&A...214..267T) |
 |
To interpret their IR HCN absorption lines in CE Leo, a 3 regime wind acceleration model was suggested: 2-3 km/s out to 3 R*; a transitional zone to reach 11 km/s near 5-6 R*; and a final acceleration up to 14 km/s near 15 R*.
(from Wiedemann et al., 1991ApJ...382..321W) |
 |
A self-consistent model with revised CO photodissociation radii was used to calculate the
gas temperature distribution in CSE (considering adiabatic and
CO line cooling and dust-gas collisional
heating) and fit observed CO lines. The best fit for CW Leo is mass loss rate of
2x10^-5 Msun/yr with a distance of 150pc. For CIT 6, the mass loss rate is
7x10^-6 Msun/yr, for AFGL 5379, ~ 10^-5 Msun/yr. (from Kastner, 1992ApJ...401..337K) |
 |
A detailed CO excitation model was presented to explore
parameter dependence of the derived gas temperature distribution. Following
factors have more than 10% of effects: cooling by 13CO
and HCN in carbon stars or by H2O in
O-rich stars; location of the inner boundary of
the molecular shell.(from Groenewegen, 1994A&A...290..531G)
(figure: the best CSE gas temperature
model when all physics has been included.)
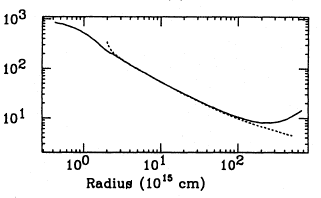 |
 |
IRAM 30m bolometer mapping of 1.3mm
continuum of CW Leo found the emission region diameter
of 100" above 3 sigma level. The dust
density roughly follows r^-2
distribution, together with passible enhancement
at r = 5" and 20". The enhancement at
r=5" is consistent with a recent increase of mass loss rate inferred
from CO data. (from Groenewegen et al., 1997A&A...322L..21G) |
 |
LVG code was used to fit observed CO lines by adjusting
power law gas temperature radial profile. They find that a ~r^-1 temperature profile is necessary to fit the
data. (from Doty & Leung, 1997MNRAS.286.1003D) |
 |
Thermal balance and radiative transfer mode was
calculated to determine the physical structure of the CSE of CW Leo. The
cooling in the model is dominated by CO emission
and adiabatic expansion while heating is
contolled by dust-gas collision and in the
outer part together with photoelectric heating
(note that HCN is important only for inner CSE).
By comparing model results with observation of various CO and 13CO lines,
they determined a mass loss rate of 3.25x10^-5
Msun/yr, CO/H2 = 6x10^-4, and
a dust-gas momentum transfer efficiency Q =
2.5x10^-2 for inner shell (r<10^16 cm) and 1.8x10^-2 for outer shell (r>10^16 cm) for
a distance of 150 pc. (from Crosas & Menten,
1997ApJ...483..913C)
(figure: comparison of radial gas
temperature distribution with previous work.)
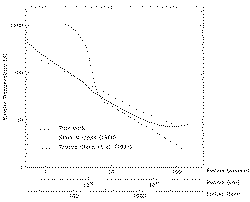 |
 |
JCMT single dish mapping of multi-transitions of CO and 13CO to CW Leo,
together with detailed heat balance (dust-gas
collision and photoelectric heating and 12CO, 13CO, HCN, H2 and adiabatic
cooling) and LVG modeling, constrained the parameters of the star as:
L* = (1.0-1.5)x10^4 Lsun, distance = 110-135 pc, mass loss
rate = 1.5+-0.3 x 10^-5 Msun/yr, dust to gas
ratio = 700+-100, 60um opacity = 250 cm^2/g, CO/H2 = 1.1x10^-3.
But the fits to CO,J=3-2,7-6 and 13CO,J=6-5 were not satisfactory. Enhanced mass loss rate might be necessary fit map
with r > 50". (from Groenewegen et al.,
1998A&A...338..491G) |
 |
They discussed the excitation of HCN to HCN maser via
hyperfine line interaction in carbon stars. (from Dinh-V-Trung &
Nguyen-Q-Rieu, ) |
 |
2-D radiative transfer simulation of the dusty CSE around CW Leo with as much observational constraints as possible
gave the basic parameter of the star (adopt a distance of 130 pc): L* = 5200~13000
Lsun, Teff = 2500~2800 K, R* =390~500
Rsun. The non-spherical CSE has bipolar openning at PA = 20 deg, with openning angle of 36 deg and tilted
towards us by 40 deg from the sky plane. Assuming Vexp = 15 km/s for the dense core, the mass loss rate was as high
as 9x10^-5 Msun/yr about 15 years ago. Dust exists out to
3 pc (angular radius of 1.3 deg). The CSE total mass is 3
Msun. Dust/gas ratio is about 0.004.
Tau_V = 40 to the center, the star light is completely invisible
at NIR. (from Menshchikov et al., 2001A&A...368..497M) |
 |
Modeling of H2O emission lines including collision and IR radiation pumping of nu2 and nu3 vibrational states
in the CSE of CW Leo showed that the observed ortho-H2O 1_10-1_01 line at 557 GHz is pumped by the radiation via
nu2 band, irrespective of spatial distribution of the molecule. Radiative pumping also brings down the ortho-H2O abundance
to (0.5-1)x10^-7. Other H2O lines observable by Herschel Space Observatory are also predicted.
(from Gonzalez-Alfonso et al., 2007ApJ...669..412G) |
 |
High resolution IR spectroscopy in 11-14um range allowed
them to identify forest of six bands C2H2 and
two bands of HCN lines. They have estimated the
kinetic, vibrational, and rotational temperatures
and the abundances and column densities of C2H2
and HCN between 1R* and 300R*
(~=1.5×1016 cm) by fitting about 300 of these rovibrational
lines. The envelope can be divided into three
regions with approximate boundaries at 0.019"
(the stellar photosphere), 0.1" (the inner dust
formation zone), and 0.4" (outer dust formation zone). Most of the lines might
require a large microturbulence
broadening. The derived abundances of C2H2
and HCN increase by factors of 10 and 4,
respectively, from the innermost envelope outward.
The derived column densities for both C2H2 and HCN are
~=1.6×1019 cm-2.
Vibrational states up to 3000 K above ground are populated, suggesting pumping by near-infrared radiation from the star and
innermost envelope. Low rotational levels can be considered under LTE, while
those with J>20-30 are not thermalized. A
few lines require special analysis to deal with effects like overlap with lines of other molecules.(from Fonfria
et al., 2008ApJ...673..445F) |

Temporal
variation (go to top)
- SiS,v=0,J=1-0 maser did not show relative variation
for a period of 10 month. But the over all strength of SiS became 1.4 times weaker at IR minimum, perhaps due to the variation of the central IR heating source.
(from Nguyen-Q-Rieu et al., 1984ApJ...286..276N)
- Variatioin of the CS, v=0, J=2-1 line had been reported
in a conference, but no detail of that report is available online. From the
description of this report in the work of Turner (1987A&A...182L..15T),
the measured TR* of this line was 1.65, 1.0 and 1.4 K on 1984 December, 1985
May and 1985 November (corresponding to IR light curve phase of 0.67, 0.96
and 0.19) respectively. It can be concluded that the CS line is
anti-correlated with IR light, which was explained by the shift of
populations from lower J levels to higher J levels during the IR maximum.
(from Claussen et al., 1987lsse.proc..165C)
- Using the JCMT SCUBA archival data, they constructed the 850um continuum light curve of CW Leo: S(Jy) = 8.8 + 0.95 * sin[2pi * (Y-1999.125)/1.74] where Y is the year, or equivalently S(Jy) = 8.8 + 0.95 * sin[2pi * (JD-2451224)/635]. The maximum phase is 120days later than optical maximum phase of Alksnis (1989) and 72days later than the 1.1mm maximum of Sandell (1994). (from Jenness et al., 2002MNRAS.336...14J)
- VLA monitoring of continuum of CW Leo at 8.4, 14.9 and 22.4 GHz within two years revealed possible variability that is correlated
with IR phase. The cm to sub-mm spectral index
is very close to 2. (from Menten et al., 2006A&A...453..301M)
|
|
![]()