|
Molecular Clouds -- molC (see
the wikipedia
definition)
Typical well-known local giant molecular clouds (GMCs):
TOC:
Basics
- Free fall time
 (Tasker & Tan, 2009ApJ...700..358T ) (Tasker & Tan, 2009ApJ...700..358T )
- Virial parameter
 with σc being one-dimensional velocity dispersion of the cloud, which includes the thermal and nonthermal contributions via with σc being one-dimensional velocity dispersion of the cloud, which includes the thermal and nonthermal contributions via  with σnt,c being the one dimensional rms velocity dispersion about the cloud's center of mass, Rc,A being a measure of cloud radius based on its projected area. (Tasker & Tan, 2009ApJ...700..358T ).
Heyer et al. (2009ApJ...699.1092H ) found αvir ~ 1 for GMCs in Milky Way. with σnt,c being the one dimensional rms velocity dispersion about the cloud's center of mass, Rc,A being a measure of cloud radius based on its projected area. (Tasker & Tan, 2009ApJ...700..358T ).
Heyer et al. (2009ApJ...699.1092H ) found αvir ~ 1 for GMCs in Milky Way.
- Cooling Curve: Cooling rate of gas as a function of temperature.
Large survey observations (back to top)
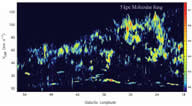
- (Jackson et al., 2006ApJS..163..145J): BU-CFARO GRS: Boston University–Five College Radio Astronomy Observatory Galactic Ring Survey
Tracer: 13CO 1-0, 110.2 GHz
Instrument: SEQUOIA multipixel array on FCRAO 14m telescope;
Method: Niquest sampling of the 46" beam with both PS and OTF mode;
Sky-coverage: l = +18 ~ +55.7deg, b = -1 ~ +1 deg (area = 75.4 deg^2);
Velocity-coverage:
-5 ~ +135 km/s in l < 40 deg range; -5 ~ +85 km/s in l > 40 deg range;
Resolution and sensitivity: rms = 0.13K @ dV = 0.21 km/s;.
Results: database with 1,993,522 spectra. They showed Iint maps, channel maps, p-v diagrams, grand average spectrum, etc.
Data availability: available online or in DVD for 20 years (2006-2026): http://www.bu.edu/galacticring/ (including some additional 13CO data between l = 14-18 deg and some CS data between l = 44.3-46.3 deg).
(figs: left -- 13CO l-b map (color scale in unit of K km/s); right -- l-v map (color scale in unit of K).)
- (Stil et al., 2006AJ....132.1158S) VGPS: THE VLA GALACTIC PLANE SURVEY
Tracer: 21cm HI line
Instrument: VLA
Method: Interferometry + masaic;
Sky-coverage: l = +18 ~ +67 deg, |b| < 1.3 to 2.3 deg;
Resolution and sensitivity: rms = 2K/beam or 11mJy/beam @ dV = 0.824 km/s; 1' x 1' x 1.56 km/s.
Results: database with 990 pointing.
Data availability: via CADC: http://www.bu.edu/galacticring/ (including some additional 13CO data between l = 14-18 deg and some CS data between l = 44.3-46.3 deg).
Phyical models: (back to top)
- (Bonnor, 1956MNRAS.116..351B)
Facts: He formulated the p-V relation (modified Boyle's law) for a spherical isothermal gas sphere that is balanced between thermal pressure, gravity, and a pressure at the outer bundary. The equation of state in this case is pV = NkT - αGM2V-1/3, where α is a constant depending on the shape of the gas.
Results: It is found that sufficiently large gas sphere is graviattionally unstable, which is comparable to the Jean's formula of gravitational instability.
- (Tomisaka, 1986PASJ...38...95T)
Facts: He simulated the formation of giant molecular clouds (GMCs) by cloud collision and their disruption by SNe.
Results: If the lifetime of GMCs is < 40 million years, GMCs should be well concentrated on spiral arms, whilst if it is > 100 million years, GMCs should be distributed fairly uniform in the Galactic disk.
- (Motte et al., 1998A&A...336..150M)
Facts: They present a 1.3mm continuum masaicing study of the Ophuuchi central region using the MPIfR 19-channel bolometer array on IRAM-30m telescope.
Results: The sensitivity is down to column density of N ~ 10^22 cm^-3. It was the first time to get the compact circumstellar dusty structures around YSOs and the extended emission from dense cores and ambient clouds detected simultaneously. The diffuse clouds are fragmented into 58 starless cores, with 19 of them showing flat intensity profile, 10 of them showing sharp peak. The fragmentation size of ~ 6000AU is consistent with the Jeans lengths of the DCO+ cores, but at least 5 times smaller than that in the Taurus cloud.The clump mass function (CMF) is ΔN/Δm ∝ m-1.5 for m < 0.5 Msun; ΔN/Δm ∝ m-2.5 for m > 0.5 Msun, which is reminiscent to the stellar IMF (with the dividing stellar mass of 1 Msun and a peak stellar mass of 0.3 Msun).
- (Testi & Sargent, 1998ApJ...508L..91T)
Facts: They present a 3mm interferometric continuum study of in the inner 5.5'x5.5' region of the Serpens core.
Results: The 26 prestellar cores show a mass distribution of ΔN/Δm ∝ m-2.1 which is consistent with the stellar IMF.
- (Ballesteros-Paredes et al., 1999ApJ...515..286B)
Facts: They did SPH simulations of HI and giant molecular cloud formation.
Results: They found that the clouds are usually trancient objects without well-defined cloud edge. Neither the thermal equilibrium nor the turbulent pressure is the cloud confining agent. Quasi-hydrostatic configurations can not be produced by turbulence.
- (Ballesteros-Paredes et al., 2002ApJ...570..734B)
Facts: They did SPH simulations of cloud core formation and evolution and tested the Larson's scaling law.
Results: They found that the Larson's density-size relation is an artifact due to limited dynamical range in column density in the old observation, while the velocity dispersion-size relation is true in both physical and observed clumps. They also confirmed that the clump mass histrogram follows a log-normal distribution.
- (Ballesteros-Paredes et al., 2003ApJ...592..188B)
Facts: They did SPH simulations of cloud core formation and evolution and tested the criteria frequently used by observers to judge if a observed cloud core is in hydrostatic equilibrium.
Results: They found that, although most of the cloud cores formed in the simulations are evolving dynamically, 65% of the cores can be matched by Bonnor-Ebert density profiles, and 47% of these BE cores correspond to stable equillirium configuration. They concluded that successful fitting of BE profile to an observed cloud core does not guarantee hydrostatic equilibrium, and the fitted parameters (mass, central density, density contrast, temperature, and radial profile of the BE sphere) may differ significantly from the actual values in the cores.
- (Larson, 2005MNRAS.359..211L)
Facts: He explored the the effects of thermal property and geometry of molecular clouds upon stellar initial mass function (IMF).
Results: (1) He argued that (a) turbulence eventually becomes unimportant in star formation because it is dissipative and decay rapidly to smaller scales; (b) magnetic field can be dissipated through ambipolar diffusion and the anisotropic magnetic field lines do not prevent matter from accumulating along the field lines. In contrast, thermal pressure work at all size scales and becomes increasingly important during the contraction of the interstellar clouds. Therefore, the Jeans mass determined by the ballance between thermal pressure and gravity is universal in the star formation processes, irrespective of what happened during the early stage of the star formation.
(2) Jeans mass sensitively depends on thermal temperature (∝ T3/2ρ-1/2 or ∝ T2p-1/2). During the cloud contraction processes, the atomic cooling rates increase with density in low density gas, thus the cloud temperature decreases with the progress of contraction. But when the density is higher than a certain threshold, the atomic cooling rates do not increase anymore (due to opacity effect), the cloud temperature reaches a minimum of about 5K (Larson 1985) and then turns to rise up due to the more and more efficient gravitational collapse heating. Therefore, the Jeans mass will decrease with further process of contraction. Consequently, the Jeans mass will decrease (thus with more active fragmentation) during the cold low-density contraction phase, whilst it will increase (thus with fragmentation suppressed) during the warmer high-density contraction phase. The critical state between the low-density and high-density contraction phases thus determines the final properties of the cloud fragmentation. This critical density is determined by the cooling properties, and thus nature and status of the material, of the clouds.
(3) He reviewed that the first generation of stars have very high mass of several hundreds solar masses, just because that the lack of heavy elements renders a very inefficient cooling through H and H2 emission. Thus the mass of the first stars is largely determined by the intrinsic atomic and molecular properties of the H2. The Jeans mass of the zero metallicity clouds is ~1000 Msun.
(4) He reviewed that there exists another 'opcity-limited' mass of clouds: the mass determined when the dust emission becomes opaque. This is important at some stages when most polar molecules have been frozen out onto grains, because then the gas is thermally coupled with dust grains and the dust thermal emission becomes the major cooling agent. This limit is 0.007 Msun, which sets the lowest possible mass for cloud fragmentation and thus for the formation any astronomical bodies through gravitational contraction.
(5) He gave an approximate description of the equation of state of cold clouds:
 , ,
where ρ18 is in unit of 10^-18 gcm-3. This is corresponding to a polytropic model with index with γ = 0.73-1.07. The details of the equation of state may be unimportant, while the qualitative aspects could be the most important: The temperature decreases strongly in the low density regime (say, with ρ<10^-19 gcm-3, cooling contraction) but varies much less in the high density regime before the opacity limit is reached at ρ ∼ 10^-13 gcm-3 (nearly isothermal contraction). Simulations support that the Jeans mass or Bonnor-Ebert mass at the critical density for the temperature minimum determines the peak mass of the IMF.
(6) Both simulations and observations found that interstellar clouds exist in a filamentary or cylindrical structures. Thus, when the density increase to a critical value when the minimum temperature is reached and the polytropic index γ = 1, the contraction toward the cylinder axis will halt and the filaments will begin to fragment into clumps.
(7) For rotating clouds, the contraction will produce a disk structure. When γ < 1, the inner disk is very thin and unstable and the fragmentation occurs from the inside out to produce binaries or small multiple systems; when γ > 1, the inner disk is thick and stable against fragmentation.
(8) He mentioned that, when γ < 4/3, spherical collapse is possible; when γ < 1, collapse to a thin filament is possible; only when γ < 0, collapse to a thin sheet is possilbe. (He did not mention: why?) Thus, with the observed γ = 0.7, collapse to thin filaments is preferred in the universe. The fragmentation main occurs in low density phase when γ < 1. In dense clouds, the cloud core can only collapse to form spherical structure.
(9) Thin sheets formed by external pressure from events such as SNe usually can not survive by self-graviting (desctroyed by internal thermal pressure or the external compressing force itself). The thin sheets in the circumstellar discs can maintain for a long enough time to fragment to form smaller stars or planets, but it does not alter the overall shape of the IMF.
(
10) the cloud contraction usually form complex fractal patterns whose fractal dimention is D = (4-3γ)/(2-γ). The Jeans length varies as ργ-2)/2, the Jeans mass varies as ρ(3γ-4)/2. The number of bound sub-structures N is related to their size L as N ∝ L-D. If γ=0.73, as observed in low density clouds, D= 1.43.
(11) The increase of CMB temperature with redshift z or near to star forming regions or galactic center, can raise the minimum gas temperature during the cloud contraction and thus limit the lower limit of stellar mass. Thus the additional input of IR radiation causes a top heavy IMF. (Why is CMB temperature = 2.73(1+z)?)
- (Ballesteros-Paredes, et al., 2007prpl.conf...63B)
Facts: They reviewed the turbulence in molecular clouds (MCs) and star formation.
Results: (1) They proposed that GMCs are formed by large-scale gravitational instability induced by the stellar spiral arms in the galactic disc mid-plane, whilst the more scattered smaller-scale MCs (distributed as turbulent atomic gas) are formed by the compression of turbulence produced by SNe, superbubbles or HII regions. Thus, the GMCs and MCs represent two distinct populations.
(2) the formation of MCs is dictated by the formation of H2 which then protect the formation of CO againt the dissociative interstellar UV field. The formation rate of H2 on grains is 10^9 yr/n. The widespread of H2 is found to be formed at density of ~10^2 cm^-3. The time needed to accumulate enough H2 column density to protect CO is about 10-20 Myr, if started from an initial condition of n~1 cm^-3, and velocity dispersion of δV=10 km/s.
(3) Because it is observationally found that δV≈1 km/s (R/1pc)β, with β=0.38-0.5, there should exist a sonic length scale λs∼0.05 pc above which turbulence can compress gas to promote the formation of molecular clouds and below which turbulence becomes less important than thermal pressure.
(4) The frequently used statistic description of turbulent clouds is the density propability distribution function (PDF). The PDF is usually a log-normal function, with the logarithmic density being in a Gaussian distribution. The logarithmic standard deviation σlogρ usually scales with logarithmic Mach number logM.
(5) Supersonic turbulence should decay in a crossing time
of the driving scale, no matter the turbulence is of HD or MHD orgin. If, as suggested by some researchers, the lifetime of MCs is comparable or even shorter than the free-fall time (constantly destroyed by star formation activities), the turbulence in MCs may never have enough time to decay.
(6) Larson's density scaling law indicates that the column density of MCs should be nearly constant. This is expected because clouds with much lower column density may not be molecular, while clouds with much higher column density may collapse quickly. MCs represent the tip of iceburg of the neutral stable gas distribution.
(7)Larson's velocity dispersion-size relation appears to be a 2nd-order structure function of turbulence (see details in Elmegreen and Scalo, 2004). The indices of energy spectrum E(k)∝kn and velocity dispersion-size relation ΔV∝Rβ are related by β=-(n+1)/2. The value found by Larson (1981), β≈0.38, is close the value for an incompressible Kolmogorov turbulence (β=1/3, n=-5/3). However, both larger and smaller beta have been determined by other work. The index of compressible flows is uncertain yet.
(8)
Thermodynamics: Atomic clouds have density of 1<n<100 cm^-3 and temperature of 100K < T < 5000K, while MCs have typical density of 100 < n < 1000 cm^-3, and locally n>10^6 cm^-3. The temperature in dark quiescent clouds is ~10K, while it can be as high as 50-100K in the strong UV field of nearby massive stars.
(9) Thermodynamics: With the heating and cooling properties of real MCs, the temperature varies with density according to the equation of state P∝ργ. But the index is different in different regime of density of MCs: (a) γ=0.75 for n<2.5x10^5 cm^-3; (b) γ=1~1.075 for n>10^6 cm^-3; dust emission becomes opaque at n>10^11cm^-3 and an opacity limit of fragmentation is > ~0.01 Msun. The clump mass function (CMF) is mainly determined by the critical density near the transition point γ=1.
(10) the star forming core lifetime is uncertain. It could be several times of free-fall time, say, several Myr.
(11) Observation of subsonic line width does not necessarily mean the cloud is in hydrostatic equilibrium, because the turubulence velocity dispersion itself scales down with smaller sizes.
(12) Observed equipartition of gravitational, kinetic and magnetic energy in interstellar clouds does not guarantee virial equilibrium, because virial equilibrium also requires the zeroing of surface and time derivatives of the clouds, which is not easy to observe.
(13) Star formation efficiency is found from simulations as SFE(λs) = exp(-λ0/λs). The fraction of mass that has Jeans length LJ<λs gives the star formation rate per free-fall time.
(14) The specific angular momentum is j ≈10^23 cm2/s for the Galactic differential rotation, 10^21 cm2/s for cloud cores below 0.1 pc, 10^19 cm2/s for a binary G-type star with an orbit period of 3 days, 10^17 cm2/s for the spin of a T Tauri star, and 10^15 cm2/s for the spin of our Sun. Thus, angular momentum must be lost at all stages of star formation.
(15) Binaries or multiple systems form when angular momentum is large enough or the large scale magnetic field is weak enough. The dynamics of multiple system can have effect to the formation of cluster. The more massive stars tend to move slower and thus sink to the center of the cluster. Accretion should be the major parth of star growth, because stellar encounter has very low possibility, unless it's in a very dense proto-cluster.
- ()
Molecular properties : (back to top)
- (Scoville & Solomon, 1975ApJ...199L.105S)
Facts: They did a b=0 deg 12CO spectral line survey of molecular clouds in the -10 deg < l < 90deg galactic longitude range.
Results: (1) the 12CO line is very strong in the inner Galaxy;
(2) there is a peak of 12CO intensity near Rgal = 5.5 kpc, corresponding to a possible molecular ring;
(3) most interstellar medium in the inner Galaxy is in H2 form, and they amount to 1-3x10^9 Msun, with each cloud weigh about 10^5 Msun with density of ~700 cm^-3.
- (Solomon, et al., 1979ApJ...232L..89S)
Facts: They did a b=0 deg 13CO spectral line survey of molecular clouds in the l < 44deg galactic longitude range.
Results: (1) the 13CO spectral line distrubiton is very similar to that of 12CO, and the similarity of the two lines of very different optical depths indicats that the 12CO line integrated intensity is a measure of cloud number density;
(2) the molecular ring at R = 4-8 kpc is confirmed by the 13CO data;
(3) Iint(12CO)/Iint(13CO) = 5.5 for most of the clouds on average;
(4) The Ncol(H2) in these molecular clouds are 10 time higher than in HI clouds;
- (5) Uniformly the Tk ~10K in these clouds.
- (Myers et al., 1983ApJ...264..517M)
Facts: They published a 13CO and C18O 1-0 line survey to 90 nearby (<~500pc) small (<5') opaque regions in nearby dark clouds.
Results: They estimated column density and Tex of C18O using the abundance ratio [13CO/C18O] = 5.5. Densities are estimated with the visual cloud sizes. The typical C18O sources have properties as below. They concluded that most of clouds should be supported by turbulence; more than half of the sources show non-Gaussina profiles and blue screwed profile dominate, indication infall motions.
(1) size = 0.3pc;
(2) Av = ~11 mag;
(3) mass = ~ 30 Msun;
(4) C18O line width = 0.6 km/s;
(5) Tau_C18O = 0.4;
(6) Tex (C18O) = 10K;
(7) Ncol (C18O) = 2x10^15 cm^-2.
- (Myers & Benson, 1983ApJ...266..309M)
Facts: They publish part of their NH3 line survey to ~100 visually opaque regions in nearby dark clouds. Strong sources are also mapped.
Results: They find mean properties for 27 observed clouds: FWHM size of 0.1pc, density = 3x10^4 cm^-3, mass = 4 Msun, Tk = 11K, FWHM dV = 0.3 km/s. They concluded that these are going to form low mass stars in the next 10^6 yr.
- (Sanders et al., 1984ApJ...276..182S)
Facts: They mapped CO 1-0 line at over 2500 positions in the range -4 deg < l < 170 deg, |b|<2deg (or 0 < R < 16 kpc, -200 pc < z < 200 pc).
Results: (1) the total mass of H2 (3.5 x 10^9 Msun) is nearly equal to that of HI (3x10^9 Msun), but 90% of H2 is inside of the solar circle, whilst only 30% of HI is.
(2) the conversion factor for I(CO1-0) => Ncol(H2) is 2-5x10^20.
(3) the H2 density radial distribution determined from CO show peaks at R<1.5 kpc and R~6 kpc, then it falls off exponentially from R = 6-15 kpc by a factor of more than 100. However, HI shows nearly uniform density distribution across the same radial distance.
(4) the scale hight of the molecular layer, Z_1/2, increases from 40-75pc from R=3-9.5kpc, with an average of ~60 pc, roughly following Z_1/2 ~ R^0.5 relation.
(5) the CO data show a warp of the disk of +-20pc on a length scale of 3-4 kpc;
(6) the CO in the nuclear disk region is tilted by 7deg w.r.t. b=0deg plane. The total H2 mass in this region is 3-5x10^8 Msun, 50 times larger than HI gas.
- (Solomon et al., 1985ApJ...292L..19S)
Facts: They mapped CO 1-0 line in the region 20deg < l < 50deg, -1.05 deg < b < 0.4 deg.
Results: (1) warm cloud cores (Tk>10K) follows spiral arms well, whilst cold cores (Tk<10K) are widespread in the disk;
(2) two molecular peaks are found: near R = 5 and 7.5 kpc.
- (Sanders et al., 1985ApJ...289..373S)
Facts: They mapped CO 1-0 line to the first cordrant of the Galaxy using the 14m FCRAO and 11m NRAO telescopes. Observed regions are |b|<2deg, at integer longitudes between 0-60 deg.
Results: (1) They detected 315 cloud features;
(2)
The galacto-centric distance distribution of surface giant cloud (L>10pc) numbers density agree well with similar radial distribution surface CO brightness, indicating that the radial distribution of CO line strength is dictated by the number of giant clouds, instead of the change of CO excitation conditions.
(3) There is a ring-like concentration of cloud number density around 4-8 kpc, similar as the distribution of CO emissivity.
(4) while giant clouds with internal heating could be associated with spiral arms (H II regions), cooler clouds are scattered widely in the disk;
(5) among 80 clouds near tangent points, power laws are found as:N(D) ~ D^-2.3, N(m) ~ m^-1.58, ΔFWHM(km/s)=0.88D^0.62, n(H2) = 290 (D/20pc)^-0.75 cm^-3.
(6) 85% of the H2 mass in the inner Galaxy is in ~6000 GMC (Giant molecular clouds: L>22pc, m>10^5 Msun), totaling up to ~3x10^9 Msun.
(7) They also discussed some issues in determining kinematic distance: (a) in the l<5 deg and l>70deg regions of the first quadrant, the typical random cloud motions of dV~5km/s will impose considerable uncertainty upon the kinematical distance; for all clouds near the tangent point in the l>10 deg region, the same random motion will induce a large uncertainty of ~1.5 kpc; (c) on the Galactic plan (|b|<4 deg), the large differential rotation of ~ 10 km/s/kpc will also introduce a large uncertainty in the kinematic distance computed by assuming a constant rotation velocity of about 220 km/s. They also proposed two situations to preferrentially select the near distance: (i) if the Dnear gives Z within one CO scalehight (Z_1/2=60 pc) while the Dfar gives Z byond two CO scale hight; (ii) if the Dfar gives Z larger than 150 pc.
- (Fuller & Myers, 1992ApJ...384..523F)
Facts: They mapped three lines (CS, C18O and NH3) toward 14 dense cores.
Results: They find velocity-cloud size relation:
(1)
FWHM ΔVobs~ R^0.4, which is independent of the presence of stars;
(2)
FWHM ΔVtot~ R^0.2,
(3)
FWHM ΔVnon-thermal~ R^0.7.
- (Vilas-Boas et al., 1994ApJ...433...96V)
Facts: They observed 13CO and C18O 1-0 line spectra toward 101 small and opaque condensations in the dark clouds Musca, Coalsack, Chamaeleon II and III, and the cometary globules in Vela and Gum nebula.
Results: They present the results and discussed some properties.
- (Falgarone et al., 1998A&A...331..669F)
Facts: They performed a survey of 12CO, 13CO and C18O 1-0 line and 12CO 2-1 line survey to three regions of molecular clouds with starless cores using the IRAM30m. The high spatial resolution of 1700AU and the multiple isotopes and transitions allow them to investigate the dissipation of non-thermal support of molecular clouds in finer scale.
Results:
(1)
Little unresolved structures in the velocity integrated maps but still presented in the velocity maps of all fields and all lines;
(2) clouds only bright in 12CO lines show filaments with large aspect ratios >~5 and larger velocity dispersion than those with all three isotopes detected;
(3) unexpectedly, smallest structures are seen mostly in more opaque and higher velocity dispersion gas;
(4) dense core are connnected to another kind of filaments that are bright in 13CO and 18CO;
(5) found uniform CO 2-1/1-0 line ratio of 0.65+-0.15 for both strong and weak 12CO and 13CO lines in all three fields;
(6) 13CO line is similarly strong as 12CO lines, although neither flat-top nor self-reversed profiles are seen;
(7) there is an anticorrelation between the 13CO line instensity and line width.
Conclusions:
(1) The CO lines are formed in very small cells that are smaller than ~200AU with nH2 ~ 10^3 cm^-3 when the 13CO is barely detected but up to two orders of magnitude denser when all three isotopes are detected;
(2) The anticorrelation between
the intensities of the 13CO lines and their linewidths indicates a gradual loss of the non-thermal
support which increases the phase-space radiative coupling of
the cells.
- (Vilas-Boas et al., 2000ApJ...532.1038V)
Facts: They observed 13CO and C18O 1-0 line spectra toward 110 small and opaque condensations in the dark clouds Lupus, Corona Australis, Norma, Vela, and Scorpius.
Results: They resent the results and discussed some properties.
- (Lada et al., 2008ApJ...672..410L)
Facts: They investigate the entire population of starless cores within a single molecular cloud, Pipe nebula.
Results: Most starless cores are unbound Bonnor-Ebert cores in pressure equilibrium with a common ambient pressure. The clouds are mainly thermally supported and the non-thermal motion is usually subsonic. The CMF (and ultimately the stellar IMF) has its origin in the
physical process of thermal fragmentation in a pressurized medium.
Dust properties : (back to top)
- (Ossenkopf & Henning, 1994A&A...291..943O)
Facts: Based on their dust grain accretion and coaggulation model, they compute and tabulate dust opacities from 1um to 1.3mm for grains in dense cores (with standard MRN-distribution of grain sizes). (for grains in diffuse clouds, see Draine & Lee, 1984ApJ...285...89D). The optical property of the ice mantle is that of the 'weak interstellar mixture' (H2O:CH3OH:CO:NH3=100:10:1:1).
Results: The tabulated dust opacities are reliable for dense core mass estimation with an uncertainty no larger than a factor of 2 (say, dust evolution and various parameters have little effects. They recommend 1.3-mm dust opacity of 1 cm2/g for very dense regions (nH>10^7 cm-3) and 0.8 cm2/g for intermediate densities (nH ~ 10^5 cm-3).
Data: The dust opcity data are available for MRN, MRN+thin ice and MRN+thick ice grains at VizieR: Online data.
The data are give for different ice thickness and gas density. They are continuous function of the parameters and interpolation can be applied (hyperbolic interpretation in the logarithmic density and opacity regime, use their eq. 6).
- (Malinen et al., 2011A&A...530A.101M)
Facts: They tested the accuracy of the core mass estimation from IR and sub-mm dust emission.
Results: Wrong assumptions of dust opacity and its spectral index β can cause significant systematic errors in mass estimates. Only the slope of the mass spectrum is reliable.
Chemistry: (back to top)
- (Dickman, 1978ApJS...37..407D)
Facts: He compared LTE column density of 13CO with visual extinction at 100 locations in 38 interstellar dark clouds.
Results: He found a linear relationship between the 13CO and the visual extinction, from which he proposed the use of 13CO to trace H2 column density:
N(H2) = 5.0±2.5 x 10^5 N(13CO) [cm^-2]
which inplies that 12% of the gas-phase carbon is in the form of CO. He also assessed the reliability of the LTE method in dermining 13CO column density by comparing with LVG modeling: The LTE model slightly overestimates the Ncol(13CO) and underestimates the τ(13CO) only toward the highly obscured central part of the cloud, and slightly underestimates the Ncol(13CO) and overestimate the τ(13CO) toward the less obscured parts of the clouds. The unerestimation of column density is ≥ 2 only when Av≤2.
- (Frerking et al., 1982ApJ...262..590F) (to be read in detail...)
Facts: ...
Results: They found a relationship between the CO and H2 abundance: [H2/12CO] = 1.1x10^4.
- (Milam, 2005ApJ...634.1126M) (to be read in detail...)
Facts: ...
Results: They derived the [12C/13C] = 6.2 R_GC + 18.7 discribution (R_GC is the galactocentric radius) for the Milky Way galaxy.
- (Lombardi et al., 2010A&A...519L...7L)
Facts: They investigated Larson's 3rd scaling law between masses and sizes of molecular clouds by applying a large dynamical range near-infrared exccess method to a set of nearby molecular clouds.
Results: It is found that the Larson's 3rd law still holds even for large dynamical range observations. That is to say, different clouds have almost identical
average column densities above a given extinction threshold; this holds regardless of the extinction threshold, but the actual average
surface mass density is a function of the specific threshold used. The results indicates that molecular clouds are characterized by a universal structure that can be linked to the log-normal nature of cloud column density distributions (the probability distribution of the ln of extinction A , say, lnA, in the projected molecular cloud region, see literature in the paper) with a narrow range of parameter values. However, the Larson's 3rd law does not apply to a single cloud, particularly it fails for cloud radius is larger than 1 pc.
Turbulence in molcular clouds: (back to top)
- Methods to investigate turbulence in observations:
- (Larson, 1979MNRAS.186..479L)
Facts: He studied the relation between velocity dispersion and cloud sizes on the basis of literature data of young stars and cool interstellar gas.
Results: The velocity dispersion is found to be systematically increasing with linear cloud sizes: σ (km/s) = 1.10 L(pc)^0.37 (1 pc < L < 1000 pc). It suggests a turbulent hierarchy of motions in which smaller-scale motions are produced by the turbulent decay of larger-scale ones
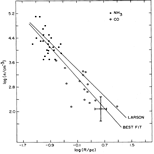
- (Larson, 1981MNRAS.194..809L) ****
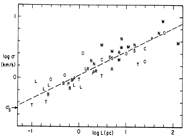
Facts: From a collection of literature line data of 13CO (in some cases of H2CO, NH3, OH, HC3N, HC5N, SO, HCO+ and HI) toward a sample of molecular clouds or cloud regions, he studied the physical properties of them. (He used [13CO/H2] = 2x10^-6 from Dickman 1978 and assumed H2 constitutes 70% of the mass.)
Results:
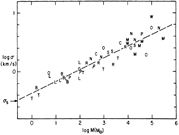
- The internal velocity dispersion σ of molecular clouds is well correlated with its size and mass as a power law, akin to the Kolmogoroff law (σ ~ L^1/3) for subsonic turbulence. It suggests that the observed motions in the clouds are part of a common hierarchy of interstellar turbulent motions.
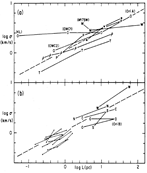
The energy source should not be the stellar activities, because the considered size scales is too large for stellar winds or SNe. The power laws also hold for sub-components of the same clouds.
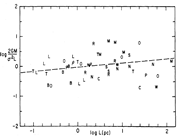
- σ-size correlation: σ (km/s) = 1.10 L(pc)^0.38 (0.1 pc < L < 100 pc) **
- σ-mass correlation: σ (km/s) = 0.42 M(Msun)^0.20 (1 Msun <M < 3x10^5 Msun)
- virial ratio-size correlation: 2GM/(σ^2L) = 0.92 L(pc)^0.14 (roughly in virial equilibrium: the ratio = 1.) **
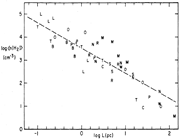
- density-size correlation: n(H2) =3400 L(pc)^-1.10 or column density ~ constant (10 cm^-3 < n(H2) < 10^5 cm^-3, redundant with the first two correlations.) **
- These clouds are mostly gravitationally bound and in approximate virial equilibrium, however, they should be formed by supersonic hydrodynamics (turbulence), instead of gravitational collapse.
- The smallest clouds mass below which the internal motion is no longer supersonic set the lower limit of protostellar mass to be a few tenths of Msun.
- Massive protostellar clumps are always supersonic, thus their internal structure are complex. They may form multiple stars.
- Molecular clouds must be trantient structures, they will be dispersed not more than a life time of 10^7 yr, because there is a turbulence time scale of τ = L/σ ~ 10^6 L(pc)^0.62 which varies from 2x10^5 to 1.5x10^7 yr for the internal motions. The free fall time scale is roughly one half of τ.
(figs: correlations of σ-L, σ-L of subregions, σ-M, σ-virial ratio, and ρ-L, respectively.)
- (Leung et al., 1982ApJ...262..583L)
Facts: They performed high spatial resolution CO mapping to a dozen of isolated dark globules.
Results: The internal velocity dispersion is also found to be correlated with cloud size as a power law: Vturb = 0.58 R(pc)^0.48 (for 0.2 pc < R < 4 pc; note the different definition of velocity dispersion from Larson 1981), which indicates that the dark globules are also controlled by hierarchical trubulence system. The larger exponential of 0.48 than the subsonic Kolmogoroff law (beta = 0.38) indicates energy dissipation at the large size scales of supersonic turbulence via shock fronts. They also found good correlation with cloud mass: Vturb = 0.21 M(Msun)^0.21, and with gas density (decreasing trend; formula not given), indicating that most of dark globules are in virial equilibrium.
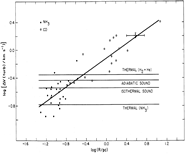
- (Myers, 1983ApJ...270..105M)
Facts: He investigated the relationship between molecular line width of NH3, CO and 13CO 1-0, cloud size and cloud density toward a sample of 43 dark clouds with narrow line width (spans across supersonic and subsonic clouds).
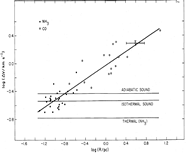
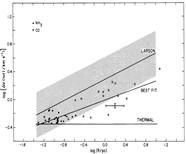
Results: Significant correlations are found for these subsonic clouds (see below). They conclude that the scaling laws of large clouds hold also for smaller-scale subsonic clouds.
line FWHM: log(ΔV) = 0.50 logR-0.028;
turbulence full width: log(ΔVturb) = 0.52 logR-0.12;
H2 velocity full width: log(ΔVtot) = 0.27 logR-0.005;
density: log(n) = -1.3 logR+3.0;
(figs: left -- dV-R relation; left middle -- dVtot-R relation; right middel -- dVturb-R relation; right -- density-R relation.)
- (Goodman et al., 1998ApJ...504..223G)
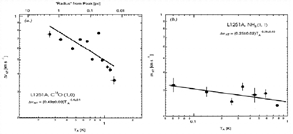
Facts: They studied how line width depends on spatial scale in low-mass star forming regions. Multiple tracers such as OH maser,12 CO, 13CO, C18O 1-0, and NH3 lines are used.
Results: (1) They found that a non-thermal line width-spatial scale relation exists for larger size scales, the non-thermal line width becomes nearly constant for smaller spatial scales below some critical value of R0 ≈ 0.1pc. They arbitrarily proposed a simply parameterized formula for the non-thermal line width: σNT2=σ02[1+(R/R0)2a].
(2) The transition radius R0 is different for different clouds, so that combinations of different tracers for different spatial scales will produce various kinds of line width-spatial scale correlations. They mentioned four types of the correlations: Type 1 -- multi-tracers, multi-clouds; Type 2 -- single-tracer, multi-clouds; Type 3 -- multi-tracers, single-cloud; Type 4 -- single-tracer, single-cloud.
(3) The column density-size relation is much steeper (N∝R-0.9) inside the coherent core (with higher volume filling factor), but shallower (N∝R-0.2) outside (with lower volume filling factor).
(4)
They proposed that the region within transition radius R0, can be called a coherent dense core. The candidate explanations for the transition from ambient clouds to central coherent core include: dissipation scale of magneto-turbulence or Alfvenic waves; decrease of ionization degree; or establishment of Jeans mass (collapsing part).
(fig: different VNT-TA relations traced by different molecular tracers: left -- more extended C18O; right -- more compact NH3.)
- (Hennenbelle & Chabrier, 2008ApJ...684..395H)
Facts: They derived an analytic theory of prestellar core mass function (CMF) on the base of Press-Schechter statistical formalism. Their model is based on the general idea of gravothermal and gravoturbulent collapse. They concentrate on collapsing clouds that is identified by applying a selection criterion. They try to link the CMF to stellar IMF.
Results: (1) They can reproduce the IMF shape better at the low mass and high mass ends than previous work in which turbulence support of clouds is not considered;
(2) the supersonic turbulence support entails a larger turbulence Jeans mass, and thus produce more high mass cloud clumps to better reproduce the power law tail of the observed IMF;
(3) the thermal motion support produces the intermediate mass cloud clumps;
(4) the low mass turn-over under the characteristic Jeans mass of the IMF is mainly the result of the Gaussian (log-normal) distribution of density and the threshold condition for collapsing clumps, but not the result of turbulence.
(5)
Although turbulence support of clouds help to produce more low mass and high mass clumps, the net effect of turbulent is to decrease the star formation efficiency.
(6) The univerality of the IMF despite of the variable CMF peak position is due to the opposite scale dependences of the Mach number and Jeans mass;
(7) The success in reproducing the IMF from CMF indicates that the IMF is largely determined by the univerality of the self-similar nature of turbulence and the comparable cloud conditions (controlled by cooling). Small scale processes like accretion, ejection, collisions, and winds are not dominant mechanisms.
- (Brunt et al., 2009A&A...504..883B)
Facts: They applied principle component analysis method to compare the statistics of turbulence in simulated and true molecular clouds to investigate the size scales of driving energy source.
Results: They conclude that the observed clouds can be best explain with large-scale energy injection, whilst small-scale driving is only important in central core regions on smaller size and time scales.
- (Heyer et al., 2009ApJ...699.1092H)
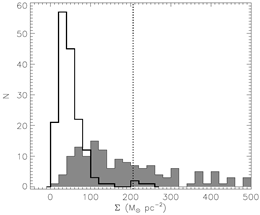
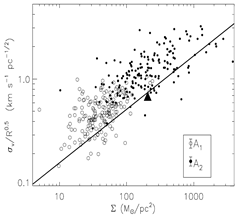
Facts: They used the 13CO 1-0 data from the Boston University-FCRAO Galactic Ring Survey (GRS) to re-exam the Larson's scaling relation of giant molecular clouds. Compared with the work of Larson and later work of Solomon et al., the 13CO 1-0 data have higher spatial resolution, smaller optical depth, and thus, allow a better definition of the individual clouds.
Results: They find
(1) the average cloud mass surface density (average column density, Σ) is 42 Msun/pc^2, which is smaller than previous value determinded from 12CO 1-0 data (Σ=206 Msun/pc^2). The mass surface densities show no galactocentric dependence.
(2) the cloud mass surface densities (Σ) are not constant among the 13CO 1-0 clouds, and the normalization factor of the velocity structure function (v0 = σv/R1/2, which is expected to be constant according to Larson's scaling law) showes up as a power law of the non-constant mass surface density: v0 ~ Σ1/2, which can be better explained with the Alfven waves in magnetically supported clouds.
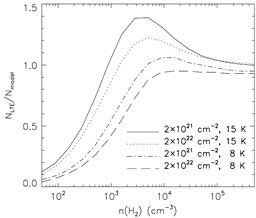
(figs.: left -- histrogram of the mass surface density Σ (thick line for large cloud areas, shaded region for small 13CO clouds) ; middle -- the correlation v0 ~ Σ1/2, with v0 = σv/R1/2 being the normalization factor of the structure function; right -- the test of the reliability of LTE column density against LVG model.)
|
![]()