|
Astro-chemistry
Table of contents
Some Useful Data Tables
(back to top)
Astrochemistry Databases
(back to top)
-
UDFA06 -- The UMIST Database for
Astrochemistry 06. The database gives following quantities:
(1/3 rates measured, include high temperature data for shock chemistry.)
I -- reaction number
Type -- reaction type
(NN,IN,CE,II,DR,RR,AD,RA,PH,CP,CR,CD,CI,IM,CL, see meanings below)
R1,R2,R3 -- are reactants [R3 is optional]
P1,P2,P3,P4 -- products [P2,P3,P4 are optional]
Alpha,Beta,Gama -- constants in reaction rate
coefficient formula (see the formula below)
Source -- source of data (M=measured,
E=estimated, C=calculated, L=literature)
Tl,Tu -- lower and upper limit of temperatures
at which the rate coefficient holds
Accuracy -- (A: <25%, B: <50%, C: within
a factor of 2, D: within an order of magnitude, E: highly uncertain.)
Ref. -- Reference code
Reaction rate formulas:
Two-body reactions: k = alpha *
(T/300)^beta * exp(-gama/T)
[cm^3s^-1]
Cosmic ray ionization: k = alpha
[s^-1] (identified in the database
via R2 = CRP)
Cosmic ray induced
photoreactions: k = alpha * (T/300)^beta * gama / (1-omega)
[s^-1]
(identified in the database via R2 = CRPHOT)
Reaction types:
NN -- Neutral-Neutral
IN -- Ion-Neutral
CE -- Change Exchange
II -- Atomic Ion-Ion
neutralisation
DR -- Dissociative Recombination
RR -- Radiative Recombination
AD -- Associative Detachment
RA -- Radiative Association
PH -- Photoprocess
CP -- Cosmic-Ray Proton (CRP)
CR -- Cosmic-Ray Photon (CRPHOT)
CD -- Collisional Dissociation
CI -- Chemi-ionisation
IM -- Ion-Molecular Ion
Neutralisation
CL --Collider
- NIST Chemical
Kinetics Database
-
NIST Chemistry WebBook
-
Photo rates:
-
My collection of rate coefficients from literature (click here)
|
List of evaporation temperatures (back to top)
(Note that many species evaporate around Tk ~ 100K. Thus this temperature is generally taken as the representative T for grain evaporation.)
- H: 10-15 K (van der Tak et al., 2000A&A...361..327V)
- O2:16~18 K (Acharyya et al., 2007A&A...466.1005A) or 15~20 K (Tielens & Hagen, 1982A&A...114..245T)
- O: ~20 K (van der Tak et al., 2000A&A...361..327V)
- CO: 16~18 K (Acharyya et al., 2007A&A...466.1005A) or ~20 K (van der Tak et al., 2000A&A...361..327V) or 15~ 20 K (Tielens & Hagen, 1982A&A...114..245T)
- H2CO: ~ 40 K (Garrod et al., 2006A&A...457..927G) or 45 K (Tielens & Hagen, 1982A&A...114..245T)
- OH: ~70 K (Garrod et al., 2006A&A...457..927G)
- CO2,13CO2: ~90 K (van der Tak et al., 2000A&A...361..327V)
- H2O: 90 K (Tielens & Hagen, 1982A&A...114..245T, van der Tak et al., 2000A&A...361..327V); ~100 K (Garrod et al., 2006A&A...457..927G); 110~120 K (Fraser et al., 2001MNRAS.327.1165F)
- CH3OH: 90 K (van der Tak et al., 2000A&A...361..327V); ~100 K (Garrod et al., 2006A&A...457..927G); ~120 K (Blake et al., 1991Sci...254..548B); 90 K (if trapped in H2O ice) or 30 K (if trapped in CO ice) (Maret et al., 2005A&A...442..527M)
- HCOOH: ~100 K (Garrod et al., 2006A&A...457..927G)
- HCOOCH3: ~100 K (Garrod et al., 2006A&A...457..927G)
- NH3: ~100 K (Garrod et al., 2006A&A...457..927G)
- --------------- from experiments (T beyond which residence time sharply decreases to ~ 1yr or shorter) ------------------
- (Note: below these temperatures, the residence times rise up sharply by several to tens of orders)
- H2 on H2O:CH3OH ice: 10-15 K (Sandford & Allamandola, 1993ApJ...417..815S)
- N2 on N2 ice: ~18 K (Collings et al., 2004MNRAS.354.1133C)
- O2 on O2 ice: ~21 K (Collings et al., 2004MNRAS.354.1133C)
- CO on CO ice: ~20 K (Collings et al., 2004MNRAS.354.1133C)
- CO on CO ice: 20-30 K (Sandford & Allamandola, 1993ApJ...417..815S)
- CO on H2O ice: 30-40 K (Sandford & Allamandola, 1993ApJ...417..815S)
- CH4 on CH4 ice: ~27 K (Collings et al., 2004MNRAS.354.1133C)
- NO on NO ice: ~40 K (Collings et al., 2004MNRAS.354.1133C)
- H2S on SO2 ice: 40-50 K (Sandford & Allamandola, 1993ApJ...417..815S)
- CO2 on SO2 ice: 40-50 K (Sandford & Allamandola, 1993ApJ...417..815S)
- CO2 on CO2 ice: 50-60 K (Sandford & Allamandola, 1993ApJ...417..815S)
- CO2 on H2O ice: 60-70 K (Sandford & Allamandola, 1993ApJ...417..815S)
- CO2 on CO2 ice: ~79 K (Collings et al., 2004MNRAS.354.1133C)
- C2D4 on C2D4 ice: ~51 K (Collings et al., 2004MNRAS.354.1133C)
- NH3 on NH3 ice: 60-70 K (Sandford & Allamandola, 1993ApJ...417..815S)
- C2H2 on C2H2 ice: ~70 K (Collings et al., 2004MNRAS.354.1133C)
- SO2 on SO2 ice: 70-80 K (Sandford & Allamandola, 1993ApJ...417..815S)
- SO2 on SO2 ice: ~100 K (Collings et al., 2004MNRAS.354.1133C)
- H2S on H2S ice: ~77 K (Collings et al., 2004MNRAS.354.1133C)
- OCS on OCS ice: ~78 K (Collings et al., 2004MNRAS.354.1133C)
- CH3OH on CH3OH ice: 90-100 K (Sandford & Allamandola, 1993ApJ...417..815S)
- CH3OH on CH3OH ice: ~126 K (Collings et al., 2004MNRAS.354.1133C)
- NH3 on NH3 ice: ~92 K (Collings et al., 2004MNRAS.354.1133C)
- CS2 on CS2 ice: ~100 K (Collings et al., 2004MNRAS.354.1133C)
- H2O on H2O ice: 100-110 K (Sandford & Allamandola, 1993ApJ...417..815S)
- H2O on H2O ice: ~160 K (Collings et al., 2004MNRAS.354.1133C)
- CH3CN on CH3CN ice: ~125 K (Collings et al., 2004MNRAS.354.1133C)
- HCOOH on HCOOH ice: ~153 K (Collings et al., 2004MNRAS.354.1133C)
books, benchmark, codes, et al.
- My notes on 'Interstellar chemistry',
the book by W.W. Duley & D.A. Williams.
-
A set of chemistry benchmark problems for PDR (see the paper by Rollig et al., 2007A&A...467..187R).
-
Gas-phase
and gas-grain model by the Herbst group at Ohio State University.
-
IAU proceedings on astrochemistry:
- IAUS 231, Astrochemistry: Recent Successes and Current Challenges,
2005 (electronic
edition)
-
IAUS 197, Astrochemistry: From Molecular Clouds to Planetary Systems,
1999
-
IAUS 178, Molecules in Astrophysics: Probes and Processes, 1996
-
A very good website on Chemistry and the second law of thermodynamics (by
Prof. Frank L. Lambert, Link here)
Reviews of astrochemistry (back to top)
- Chemistry in Cold cores (Bergin & Tafalla, 2007ARA&A..45..339B)
They reviewed the study of cold cores, including IRDCs, and chemistry in them.
- Chemistry of complex molecules (Herbst & van Dishoeck, 2009ARA&A..47..427H) (to read the full text...)
They reviewed observations and chemistry of complex molecules in assorted interstellar regions in the Milky Way.
- Of the over 150 molecular species detected in space, about 50 have 6 or more atoms and are called complex molecules;
- Most of the detected complex molecules contain carbon atoms and thus can be called organic;
- In interstellar medium, the complex molecules are only detected in the denser sources;
- There are strong evidences that the complex molecules can be formed in ice on grains, although they have been detected only in gas phase (with only one exception);
- The nature of the gaseous complex molecules strongly depends on the physical conditions:
- In cold, dense regions, they tend to be unsaturated (hydrogen-poor) and exotic;
- In YSOs, they tend to be quite saturated (hydrogen-rich) and terrestrial in nature.
- Based on their spectra and chemistry, complex molecules are excellent probes of physical conditions and history of sources.
Mixed gas + grain astrochemistry (back to top)
- gas grain code modeling (back to top)
- (Vasyunin et al., 2008ApJ...672..629V)
Facts: They analyzed the effect of uncertainties of the rate coeffcicients in RATE06 database to the abundances and column densities of key molecules in protoplanetary disks, using a gas-grain chemical model and a flaring state disk model.
Results:
1) Some species are not very sensitive to the rate uncertainties: CO, C+, H+3, H2O, NH3, N2H+, and HCNH+;
2) Some other species are sensitive to the rate uncertainties in the disk regions where they are abundant: CS, CO2, HCO+, H2CO, C2H, CN, HCN, HNC, and other, more complex species.
3) However, the highest dispersion in column density is not more than a factor of ~4.
4) They also identified about 100 chemical reactions of which the rate coefficients need to be improved in futureto achieve significantly higher accuracy in the chemical modeling.
- (Garrod et al., 2006A&A...457..927G)
Facts: They run a modified version of OSU gas-grain chemistry code for hot molecular cores or corinos to investigate if saturated organic species can be effectively formed during a key stage when the cloud cores heat up from 10K to 100K. They emphasize the importance of heavy radical chemistry when surface H tend to evaporate instead of react.
Results: They found that complex species such as methyl formate, formic acid, and dimethyl ether can be produced in large
abundance during the protostellar switch-on phase, but that both grain-surface and gas-phase processes help to produce most species. The interaction of gas-phase and surface chemical networks enable some important reactions to occur that are impossible solely in gas phase. The evaporation of H atoms is a key to allow large radical reactions on grain surface. The evaporation of some abundant species such as OH, H2CO, H2O, CO, NH3, etc., at different temperatures and accretion of organic products onto grains controls the coupling of the gas and surface chemical networks. The longer the timescale for protostellar switch-on, the more important the surface processes. The observed complex chemistry in hot cores may be representative of the evaporation of organic species around 100K. They discribe the chemical evolution during the heat-up stage as follows:
- stage 1: collapse (density 3x10^3 - 10^7 cm^-3, assume about 10^6 yrs)
The collapse is initially slow and the density increases mainly in the last 5x10^5 yrs. Both gas phase and grain surface reactions become faster with time.The end products of this stage:
grain surface: major species: H2O, NH3(~15%) and CH4 (10-24%); other significant species: CO (1.5 times of H2O in the outermost 50 monolayers), H2CO, CH3OH, and H2S. ( Note that the abundance of CO2 is underestimated if compared with IR observations.)
(image: left -- surface abundances evolution near the end of the collapse stage; right -- gas abundances evolution near the end of the collapse stage.)
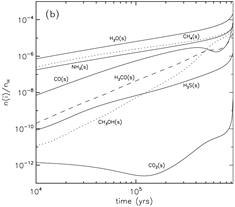 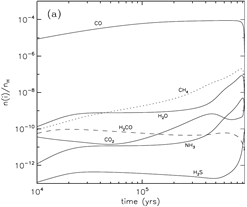
- stage 2: warm-up (standard model: assume warm-up within t_f = 2x10^5 yrs, Tk rises up from 10K to 200K.)
Methyl formate (HCOOCH3): Gas abundance -- rises up at t = 80000 yrs, Tk=40K due to gas phase reaction, then goes down due to fast accretion onto grain, then rises up again near the end of the stage due to evaporation of HCOOCH3. Grain surface abundance -- first rises up at t = 50000-60000 yrs due to surface reaction between the radicals HCO and CH3O, and soon rises up much sooner due to accretion of gas phase products, in the end, it drops down sharply due to evaporation.
Formic acid (HCOOH): Gas abundance -- rises up at t = 60000 yrs, due to gas phase reaction with evaporated CH4, then goes up the second time due to gas phase reaction with evaporated H2CO at Tk ~ 40K, then some small rise-ups due to evaporation of OH around Tk ~ 70K, in the end, it rises up again to a high value of ~10^7 due to evaporation of formic acid. However, the majority of formic acid is produced in gas phase reactions. Grain surface abundance -- first rises up at t = 60000 yrs due to surface reaction involving the radical HCO, then it continue to goes up with the help of accretion of gas phase formic acid, and continues to rise up after the evaporation of H2CO, eventually, it drops down sharply due to evaporation of formic acid.
Dimethyl ether (CH3OCH3): Gas abundance -- rises up at t = 100000 yrs, due to evaporation of dimethyl ether from grains, then it starts to rise the second time when CH3OH evaporates. The methanol + protonated methanol reaction is the major contributor of the total abundance. Grain surface abundance -- first rises up when the surface abundance of HNO falls and thus allows surface reaction to form dimethyl ether, then it drops down sharply at ~ 100000yr due to evaporation of dimethyl ether.
Formaldehyde (H2CO): Gas abundance -- it dips t = 45000 yrs, due to evaporation of N2 that produce a large quantity of NH3 to consume O and thus suppress the formation of formaldehyde, then the subsequent evaporation of CO and CH4 push up H2CO abundance strongly, then, the final rise-up is due to the evaporation of H2CO itself. Grain surface abundance -- it changes little before it evaporates around t = 800000yr.
Sulfur Species:
-- H2CS: the most abundant sulfur species in the gas. it is mainly produced by S+CH3. It gaseous abundance is very high in the model, while the value determined from observation by van der Tak et al. (2003) is only about 10^-9.
-- H2S: dominant species on grain surface. After it evaporates, it is destroyed by cosmic ray induced photons into atomic S.
The abundance can reach 10^-6.
-- SO and SO2: their abundances are 3 order of magnitudes lower than that of H2CS and H2S, but in observations, they are close to that of H2S (Wakelam 2004b). The complex sulfur chemistry is referred to viti et al. (2006).
Mentioned evaporation temperatures:
CH3OH: ~100 K,
HCOOH: ~100 K,
HCOOCH3: ~100 K,
H2O: ~100 K,
NH3: ~100 K,
H2CO: ~40K,
OH: ~70K,
CO: ~20K
(image: standard model with warm-up tim t_f = 2x10^5 yr. left -- two alternative collapse temperature model (T2(t) is assumed for standard model); left-middle -- surface abundances evolution near the end of the warm-up stage; middel, right-middle, right -- gas abundances evolution near the end of the warm-up stage.)
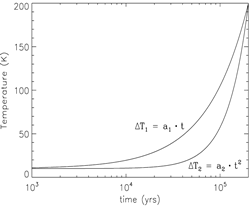 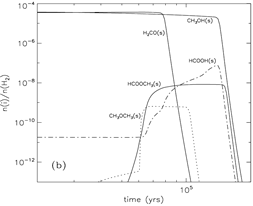 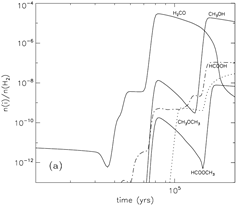 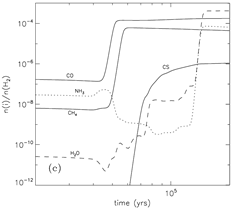 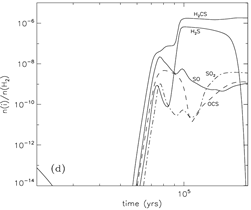
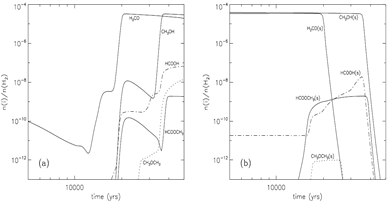
(image: gas-phase and surface abundances for faster warm-up models with with warm-up tim t_f = 5x10^4 yr.)
(image: gas-phase and surface abundances for slower warm-up models with warm-up tim t_f = 10^6 yr.)
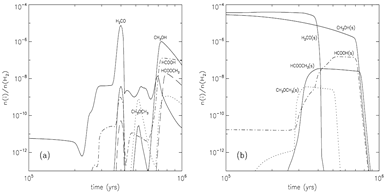
(table 4: time dependence of final abundances of some organic species.)

Pure gas phase astrochemistry (back to top)
Pure grain surface astrochemistry (back to top)
- ------------------- experimental studies of grain surface chemistry ----------------- (back to top)
- (Katz et al., 1999ApJ...522..305K)
Facts: They made temperature programmed desorption (TPD) experiment of pure H2 formation on Olivine and Amorphous Carbon surface. They used both H and D and measured the formation of HD to improve S/N ratio in the experiment. They considered main four parameters: The diffusion (E0) and desorption (E1) energy of H, the desorption energy (E2) of formed H2, and the probability (μ) of spontaneous desorption of a newly formed H2 upon recombination of two H atoms. They used following two rate equations to describe the time evolution of surface coverage of H (N1) and H2 (N2):

where F is the in flux, P1 and P2 are the H and H2 desorption probability, α is the H hopping rate. The term F(1-N1-N2) is the Langmuir kinetics (H falling upon existing H or H2 on surface will be rejected). The probabilities are related to energy barriers through Arrhenius Equation:

where ν is the attempt frequency (characteristic frequency) and T the grain temperature. Then, the production rate of H2 on the surface is

Results:
(1) For Olivine, they found E0 = 24.7 meV, E1 = 32.1 meV, E2 = 27.1 meV, μ = 0.33. (1 meV => 11.6045 K)
(2) For Amorphous Carbon:
E0 = 44.0 meV, E1 = 56.7 meV, E2 = 46.7 meV, μ = 0.413.
(3) Counter intuitively, H is adsorbed in a deeper well than H2.
(4) Assuming steady state in astrophysical condistions, the recombination rate (formation rate) of H2 peak around 5-10 K on olivine surface, but around 9-15 K on AC surface. The low H2 formation rate at lower Tk than this range is due to the lack of mobility of H on the grain surface at the low temperature; the low H2 formation rate at higer Tk than this range is due to too short residence time of H on grains. The too low recombination temperature on olivine indicates that AC grains could be the dominant place for H2 formation in astrophysical conditions.
- (Fraser et al., 2001MNRAS.327.1165F)
Facts: They made temperature programmed desorption (TPD) experiment of pure H2O on Au strate to investigate the binding energy, pre-exponential factor of H2O ice desorption.
Results: (1) Binding energy Ed = 5773+-60K, A = 10^30(+-2) 1/cm2/s for zero order kinetics of pure H2O ice;
(2) Higher evaporation temperature of Tevap ~ 110-120K than previous values of 90-100 K;
(3) The experiment involves different desorption mechanisms: multi-layer desorption, monolayer desorption, amorphous-to-crystalline phase change.
- (Collings et al., 2003ApJ...583.1058C)
Facts: They performed experiments of CO desorption from H2O ice surface.
Results: They found that phase change of H2O ice can trap some CO at high temperature until the co-desorption with H2O ice itself:
(1) when 15K < T < 30K, desorption of part of CO and part of CO diffuse into H2O ice pores;
(2) when 30K < T < 70K, desorption of all surface CO and H2O ice experience phase change from high density amorphous ice to low density amorphous ice (collapse of some pores and entrapment of some CO in these pores);
(3) when 70K < T < 140K, nothing happens;
(4) when T > ~140K, H2O crystallization phase change occurs and some trapped CO is released with valcano desorption;
(5) when T > ~160K, H2O desorption together with the rest trapped CO.
- (Collings et al., 2003Ap&SS.285..633C)
They summarized different types of desorption and give empirical formula to describe the complex CO+H2O ice desorption and phase change processes.
(1) zero order kinetics: R = nu0e-Ed/T with vibration frequency of the adsorption bond nu0 in unit of 1/cm2/s, suitable for bulk ice such as bulk CO and H2O ice;
(2) first order kinetics:
R = nu1Nie-Ed/T with vibration frequency of the adsorption bond nu1 in unit of 1/s and surface concentration of adsorbate Ni in unit of 1/cm2, suitable for monolayer or sub-monolayer desorption such as monolayer CO on the H2O ice surface;
(3) second order kinetics: recombinative desorption, such as the formation and desorption of H2.
Note that real desorption could be more complicated than the three types, having fractal or negative orders or even have no order.
- (Collings et al., 2004MNRAS.354.1133C)
Facts: They made temperature programmed desorption (TPD) experiments for 16 astrophysically relevant species on water ice to investigate the properties of their desorption from the water ice surface in vaccum.
Results: The desorption behavior is complex, possibly involving four distinctive processes:
(1) multi-layer desorption (desorption of thick layers of pure ice);
(2) monolayer desorption (desorption of a species from a ice of difference composition);
(3) volcano desorption (release of trapped species when H2O ice anneal during warming-up);
(4) co-desorption (released together with base layer of H2O ice).
The species can be divided into three categaries:
(1) H2O-like species (H2O, NH3, CH3OH, HCOOH): dominated by hydrogen-bonds, having a single co-desorption peak, can be modelled with the known kinetics of water-ice desorption;
(2) CO-like species (CO, N2, O2, CH4, NO): having volcano desorption, co-desorption and monolayer desorption and possibly multi-layer desorption, can be modelled with the same kinetics as determined for CO;
(3) intermediate speices (C2D4, C2H2, CO2, OCS, CS2, SO2, CH3CN, H2S): having volcano and co-desorption, can be modelled using the appropriately scaled kinetics determined for the release of trapped CO. Note that C2D4, C2H2 and H2S have limit ability to diffuse through porous water ice, and thus a small monolayer desorption could be also relevant.
- (Bisschop et al., 2006A&A...449.1297B)
Facts: They made temperature programmed desorption (TPD) experiments for CO-N2 ices with pure, layered and mixed morphologies with different thickness and relative abundances.
Results: They find that pure N2 and CO ices have very similar desorption properties and their mixed CO-N2 ice has identical desorption energy for both species. They concluded that astronomical CO desorption should be 0th-order instead of the usually used 1st-order kinetics, which will affect the interpretation of the anticorrelation of CO and N2H+ in presetellar cores. Some quantitative results:
(1) the determined parameters are
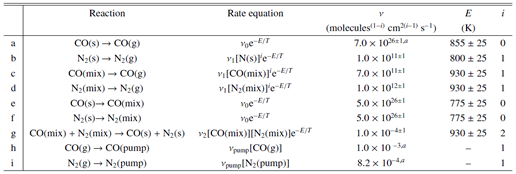
Notes: a,b -- nu is fixed to literature value; the s -> mix reaction is mixing or diffusion process; the mix -> s reaction is agregation process.
(2) the lower limit of sticking probability is 0.87+-0.5 for the CO-CO, N2-CO and N2-N2 ice at 14K.
- (Acharyya et al., 2007A&A...466.1005A)
Facts: They made temperature programmed desorption (TPD) experiments for CO-O2 ices with pure, layered and mixed morphologies for
different thicknesses, temperatures and mixing ratios.
Results: They find that
(1) O2 has a 0th-order desorption, independent of ice structure; whilst CO has 0th-order desorption from pure ice and O2 surface, but has a mixture of 0th- and 1st-order kinetics in the mixture with O2 ice.
(2) Ed (O2) = 912±15 K; Ed (CO) = 858 ±15 K for pure ices, indicating that O2 is only slightly less volatile than CO; both O2 and CO desorbe around 16-18K in astrophysical conditions. As a consequence, Ed(O2) is the largest in pure ice, smaller on CO surface, and the smallest in mixture with CO ice. Inversely, Ed(CO) is the smallest in pure ice, larger on O2 surface, and the largest in mixture with O2 ice; (Note: because O2 has a different α-crystalline structure than CO and undergos phase chagne to β-crystal around 23.5K, O2 and CO may not be inimately mixed in the experiment.)
(3) The lower limit of sticking coefficients at 20K are: 0.9 and 0.85 for CO and O2 respectively; they approach unity at 10 K in the astronomical environments.
- (Thrower et al., 2009MNRAS.394.1510T)
Facts: They made temperature programmed desorption (TPD) experiments for C6H6 on amorphous silica (SiO2) to investigate the properties of it desorption from bare SiO2 surfaces of different roughness and from a water ice surface in vaccum.
Results: They find that
(1) The roughness and porosity of the SiO2 surface has important effect to C6H6 desorption, particularly at low surface coverage, with a fast warming up settings of 0.1 K/s;
(2) C6H6 shows pore (higher desorption temperature), monolayer, multilayer and fractional kinetics (due to roughness of the surface and clustering of C6H6 on the surface);
(3) In the astronomical environments, the warming rate is much slower than in the lab and thus the importance of pores may not be so important, because the desorption is then rate limited and molcules trapped in pores have enough time to migrate to surface. Thus, The high coverage results from the lab at around 1 L exposure could be more relevent to astrophysical conditions: Ed = 4750 K with ν = 1 × 10^13 1/s or ν = 7.0 × 10^14 1/s with Ed = 5300 K.
(4) The migration into pores depends on the mobility of the molecules on the surface. Only when the molecule can move (at higher Tdust) the migration into pore becomes possible.
(5) The migration into pores is also affected by any pre-existing ices (such as H2O), because the latter can jam the pores or cover the entrance of the pores.
-
------------------- modeling of grain surface chemistry ----------------- (back to top)
- (Allen & Robinson, 1975ApJ...195...81A)
They discussed a physical model for the formation of molecules on the grain surface. Particularly
they stressed the heat-up of small grains by the energy release from the chemical reactions
on grain surface.
- (Tielens & Hagen, 1982A&A...114..245T)
Facts: They computed the ice compositions on grain surface at different physical conditions with a Monte Carlo model, under the assumption of equillibrium in gas phase chemistry. They considered in the surface chemical model:
(1) Accretion rate Rac = ni * sig_g * V (ni is the gas phase number density of species i, sig_g is the total grain cross sections, V is the thermal velocity of the gaseous species i);
(2) Thermal evaporation rate Rev = Ni * nu0 * exp(-Eb / kT) (Ni, nu0 and Eb are the total number, a characteristic vibration frequency, and the binding energy of species i on the grain surface, and T the grain temperature);
(3) evolution of binding energy from strong chemisorption (~10 kcal/mol) to weak physisorption (~2 kcal/mol) during the build-up of the grain mantle by accreting H2 (strong sites occupied first);
(4) determine which particle are mobile on grain surface by comparing their timescale to scan over the whole grain surface through quantum mechanical tunneling with their timescale of collision with a grain (only H, H2, C, N and O are mobile, they used the tunneling timescale on a perfect H2O surface);
(5) only consider significant surface chemical reactions with the selected mobile species;
(6) surface reaction involving a H atom has an activiation energy barrier Ea, thus, the probability of these reactions are controlled by evaporation and surface scanning time (throu. tunneling) and tunneling time throu. Ea (evaporation time of H is much shorter than H2);
(7) Some H2 and radical reactions are also considered (usually limited by accretion time of the radical and the activation barrier Ea);
(8) UV photolysis rate Rph = sig_g * e * G0 * f(tau_UV) (sig_g is total grain cross section to UV photons, e is number of photolized molecules per UV photon, G0 = 10^8 cm2/s is local interstellar UV field strength from Habing (1968), f(tau_UV) > 8x10^-4 is the attenuation factor to the UV field).
They also considered following six desorption mechanisms in the absence of heat sources and shocks:
(1) [impossible] chemical desorption induced by the energy released locally during surface chemistry. This is almost impossible, because the energy is largely transfered to neighboring molecules and rotational motion, instead of all transfered to translational motion;
(2) [important only for small grains] chemical energy released from the surface reactions heats up the grain and results in thermal desorption. This is important only for grains smaller than 50A in size and thus these small grains usually do not form ice mantles and their surface reaction directly contribute to the gas phase abundances;
(3) [important only for small grains] UV photon induced thermal desorption is important only for small grains (size < 50A) by raising their temperature (not included in their computation);
(4) [important only at cloud edges] photo-desorption that is charaterized by the condition when the accretion rate Rac = sig_g * ni * vi is equal to the photo-desorption rate Rph = sig_g * Ypd * G0 * f(tau_UV) becomes important when the optical depth is small near cloud edges (sig_g is the total grain cross section to UV photons, ni and Vi are the gaseous number density and average velocity of species i, Ypd ~ 5x10^-4 is the photodesorption yield, G0 = 10^8 cm2/s is the local interstellar UV field strength, f(tau_UV) is the attenuation factor of the UV field at a optical depth of tau_UV.) When f(tau_UV) > 2x10^-4 n0, photo-desorption dominates in the cloud (with ni = 10^-3n0, vi ~ 10^4 cm/s). Thus, in diffuse clouds or small dark clouds with Av < 6mag, mantle growth is prohibited by the photo-desorption;
(5) [?possibly important] explosive release of photo-chemical reaction energy stored in radicals by triggering such as grain collision can evaporate molecules.
(6) [important for rare species not made in gas phase] cosmic ray induced desorption by transiently heating the grain (the desorption rate is Rcr ~ 10^-8 s^-1 for c.r. ionization flux zeta0 = 10^-17 s^-1, binding energy of 1000K to a H2O surface, and a grain size of 0.1um.)
Results:
(1) elemental abundances has important effects upon grain mantle composition;
(2) in equilibrium in gas phase, the major elements H, C, O, N are not all in atomic form, but in
(2.a) C -- almost all goes into CO;
(2.b) O -- beside in CO, also in O or O2 form;
(2.c) N -- almost all in N2.
(3) the formation of H2 on grains could be intermediated by HCO, HS, N2H, N2H3 etc on the surface, instead of directly formed throu. H + H + grain -> H2;
(4) T dependence of grain mantle compositions:
(4.a) Td < 8K, C, N, O are trapped on surface and are immobile, thus only form H2O and H2CO through hydrogenation;
(4.b) Td > 20K, n0 > 10^5 cm^-3, pure CO and O2 ice has evaporation temperature in the 15-20 K range, thus the mantle doesn't grow;
(4.c) n0 < 10^5 cm^-3, H2CO evaporate at 45K, H2O evaporate at 90K, the mantle may still grow until the accretion rate of H is ballances with the evapration rate of CO and O2;
(5) the major composition of grain mantle: H2O, H2CO, N2, CO, O2, CO2, H2O2, and NH3 in varying amount.
-
(Hasegawa et al., 1992ApJS...82..167H)
They presented a chemical model with differential equations for dense interstellar clouds.
Both gas and grain chemistry are included. The only desorption mechanism is evaporation, thus large molecules are accumulated on grain surface. Three different typical initial conditions
were compared. The early time model results can explain the observed grain and gas phase abundances.
Significant abundances of complex organic molecules can also be achieved on grain surfaces.
-
(Hasegawa et al., 1993MNRAS.261...83H)
A new model was presented for dense interstellar clouds to include more gas and grain reactions. They considered exothermic reactions involving H2 on the grain surface. They also developed simplified rate coefficients for cosmic ray induced desorption. Only light molecules can be desorbed by the cosmic ray heating.
However, long time evolution of the model for t>10^6 yr doesn't agree with the observations
of many gas phase molecules in dense clouds yet.
-
(Hasegawa & Herbst, 1993MNRAS.263..589H)
They presented a numerical model for dust surface chemistry at a low temperature of 10K. Only physisoption sites were considered and the number of sites was simply estimated from the geometric space available for placing molecules on the grain
surface. The formation of multiple layers of grain mantle renders the buried
material chemically inert (three-phase model: gas-surface-mantle). But lightest species H, H2 and He are assumed not to be buried, because they can
easily diffuse to surface. Cosmic ray induced desorption is
important to maintain a reasonable amount of heavy species in gas phase.
The three-phase model has significant effect to the abundances of reactive
species, but not to inert species. Abundance of condensed CO strongly depends on surface H abundance.
-
(Willacy et al., 1994MNRAS.267..949W)
They proposed that the formation of H2 on grain may release energy to produce desorption of physisorbed molecules from grain mantle.
-
(Willacy et al., 1994MNRAS.269..921W)
They discussed several desoption mechanisms and applied them to a chemical model of star formation region.
-
(Shalabiea et al., 1998ApJ...502..652S)
Due to the descrepancies found between rate equation approach and Monte Carlo
simulation, they tried to modify the rate equations to take the discrete nature of grains into account (molecules on one
grain can not react with molecules on other grains). The modified approach showes different behavior only when H is in the form of H2 in the initial condition and the
difference tends to dissappear at late time of evolution. So the old rate equation approach is still
partially correct.
-
(Ruffle & Herbst, 2000MNRAS.319..837R)
They adopted the latoratory result that the diffusion of H atom on grain surface is slower than
previously thought and adjust gas and surface chemistry code to allow slowed-down H (and other
species) mobility and applied it to quiescent dense cloud cores.
-
(Duley, 2000MNRAS.319..791D)
He showed that the porous structure of grain aggregates can be a place for the formation of complex molecules.
- (Wakelam et al., 2010A&A...517A..21W)
Facts: They did a series of pseudo-time-dependent homogeneous cold dense core (or 0D) chemical model computation for a grid of parameters chosen by Monte Carlo simulation to sample the reasonable ranges of the parameter space. The purpose is to investigate which factors are the most sensitive in determining observable chemical abundances.
Results: They find that the reaction rate coefficients are the most critical before the age of 4x10^5 yrs and elemental abundances in gas phase are more important after that age. At typical times of best agreement with observation, models are sensitive to both
of these parameters. The models are less sensitive to other parameters such as the gas density and temperature.
- ------------------- observations of grain surface chemistry----------------- (back to top)
- (Johnstone et al., 2003A&A...412..157J)
Facts: They observed cornerstone molecules (CO, H2CO, CH3OH, HCN, HNC, CN, CS, SO) toward 7 submm-bright Orion molecular cores (5 prostars ranging from 1-500 Lsun + 1 shock front + 1 PDR) to quantify the physical and chemical conditions.
Result: They find that CO/H2 is an order of magnitude lower than the general molecular cloud value of 10^-4 in all cores but the shock front and PDR. The abundances of CO, H2CO, CH3OH and CS show increasing trends with the H2CO rotational temperature.
- (Knez et al., 2005ApJ...635L.145K)
Facts: They present the Spitzer IRS 5-20 um spectra of ices behind Serpens and Taurus molecular clouds to study the grain surface ice composition prior to the formation of stars.
Result: Prominant H2O ice absorption bands are found at 6.0 and 6.85um, and some CO2 ice bending mode absorption band at 15um. The 6.0um feature is from the bending mode of pure H2O ice, in contrast to that observed in YSOs. The 15um feature is lack of crystallization, confirming the prestine nature of the ice. Residual absorption features also indicate the existence of some minor species such as HCOOH and NH3. The results provide the initial conditions for the astrochemistry modeling of star formation processes.
- (Oberg et al., 2008ApJ...678.1032O)
Facts: They analyzed the 7.7um solid CH4 absorption feature in the Spitzer IRS 5-20 um spectra of 25 low mass SFRs.
Results: CH4/H2O = 2-8% for most sources, except three ones with CH4/H2O = 11-13% (with higher uncertainty).
Conclusions:
The CH4 abundance is equal to or higher than in massive SFRs, supporting the surface chemistry of methane where CH4 is formed through sequential hydrogenation of C on grain surfaces, disapproving the other two competing theories: formation from CH3OH and formation in gas phase with subsequent freezeout.
- (Zasowski et al., 2009ApJ...694..459Z)
Facts: They present the Spitzer IRS 6-15.2 um spectra of ices toward Taurus-Auriga Class I/II protostars to study the grain surface ice composition.
Result: They find the average ice composition: dominated by H2O ice, CO2/H2O~12%, CH3OH/H2O >= 2-9%, NH3/H2O ~ 14%, CH4/H2O ~ 3%, H2CO/H2O ~ 2%, HCOOH/H2O ~ 0.6%, and SO2/H2O ~ 0.5%. Radiation makes the prestellar ice environments even richer.
Photo-chemistry
(back to top)
-
Photodissociation of H2 and CO
(back to top)
-
(Field et al., 1966ARA&A...4..207F )
They reviewed structure, experimental measurements and observations of
H2.
-
(Stecher & Williams, 1967ApJ...149L..29S)
Although the dissociation energy of H2 is only about 4.48 eV, the direct
photodissociation is very inefficient because H2 is a homonuclear molecule
that has no permanent electric dipole. A more efficient way of photodissociation
is the excitation of H2 to higher electronic states B or C, respectively about 11% and
6% of the subsequent casecade back to electronic ground states will fall onto
vibrationally unstable states with vibrational quantum number v>14 and result
in dissociation of H2. Because allowed photodissociation transition of H2 begins at 14.7 eV and the ionization continuum of H2 begins at 15.4 eV, both larger than the Lyman limit of the H I, H2 is usually shielded by H I in HI clouds.
-
(Hollenbach et al., 1971ApJ...163..165H)
They discussed the production of H2 on grain surface and the destruction of H2 by photon absorption in interstellar clouds. The H2 line absorption is more important than dust continuum absorption in the destruction of H2.
H2 photodissociation is achieved by electronic transition line absorption
and followed radiative decay that falls onto the vibrational continuum of H2
and so results in the dissociation. The resultant H2 abundance mainly depends on opacity of the clouds. In typical HI clouds, the H2 abundance is about f=2nH2/(nH+2nH2)~10^-3. In denser molecular clouds, f can be as high as 0.5.
-
(Hollenbach & Salpeter, 1971ApJ...163..155H)
They discussed the formation of H2 on dust
grains. On the surface of regular grain surface, the formation rate is small when Td>13K. With irregular grain surface on which there are more lattice defects, this
critical temperature can extends to 25-50K, and so allows more efficient
formation of H2 in HI region.
-
(Federman et al., 1979ApJ...227..466F)
They improved the H2 photodissociation treatment by using more accurate self-shielding integral, treating anisotropic dust scattering, and including excited rotational states of
H2. A H2 formation to destruction rate ratio of 6x10^-5 was found.
-
(van Dishoeck & Black, 1988ApJ...334..771V)
CO photodissociation problem has been anlysised. The dissociation
is mainly controlled by UV line absorption through predissociation excitation, instead of UV continuum, because of the lack of repulsive
levels in the excited B and C electronic states. The critical wavelength
range for CO dissociation is 912-1076A. Optical
depth dependence of the CO photodissociation in different interstellar clouds are explored.
-
Interstellar Radiation Field in theSolarNeighbourhood (back to top)
- Experimental (back to top)
- (Oberg et al., 2007ApJ...662L..23O)
Facts: They performed the first laboratory study of the photodesorption
of pure CO ice under ultra–high vacuum conditions. The broadband hydrogen microwave discharge UV lamp is designed to imitate the interstellar UV field in the 7-10.5 eV wavelength range.
Results:
(1) photodesorption rate is = 3(+-1)x10^-3 molecules/UV-photon pure CO ices;
(2) photodesorption rate is < 2x10^-4 molecules/UV-photon pure N2 ices;
(3) the photodesorption of CO is not sensitive to the thickness of ice, indicating that only the surface layer is photodesorbed;
(4) the photodesorption of CO is linearly dependent on the input UV intensity and start immediately when the UV lamp is turned on, which indicates that the desorption of CO is not via heating up of the whole ice but a single-photon process. This is contrary to the photodesorption of H2O in literature;
(5) the fact that CO has much higher photodesorption rates than N2 indicates that the photodesorption may involve electronic + vibrational transition as:
(5.1)
the polar molecule CO absorbes a UV photon (7-10 eV, A¹Π-X¹Σ+) and jumps to an excited electron state;
(5.2)
then the CO jump back to a ground electronic but exited vibrational state;
(5.3)
in the end, the vibrationally excited CO has a high change to desorb due to larger attempting frequency ν;
(5.4)
it is unclear if this event involves more than one molecules, the low photodesorption rate of N2 is explained by its non-polar nature (does not absorb UV light).
- Modeling (back to top)
- (Tielens & Hollenbach, 1985ApJ...291..722T)
Facts: They systematically studied the properties and chemistry of general PDRs near the surface of dense clouds that are illuminated by a 10^3-10^6 times stronger FUV (6-13.6 eV) field than typical interstellar field. The 1-D model extends Av=10 into the cloud. The model relates the observable lines and continuum emission to the gas density, temperature, FUV flux, elemental abundances, and grain properties.
Conclusions:
(this is the 1st modeling of dense PDR)
- The PDR model consists of three parts:
(1) a hot atomic surface region (T>100K, H, O, C+, Av<3, H2 vibrational lines);
(2) a warm partially dissociated region (T~100K, H2, O, C, CO, Av=3~5);
(3) a cooler iterior region (T<100K, Av~10, H2, CO, O).
- The gas in the warm region is mainly heated by photoelectrons to a temperature much higher than that of the grains (using the photoelectron data from de Jong 1980).
- The gas cooling is dominated by O I 63 and 145um and C II 158um lines and their intensities and ratios are related to gas density and temperature.
- Only 10^-2 to 10^-3 of the incident FUV flux is channeled into the line emission, while the rest are converted in to dust emission. But this value depends on the gas temperature, electron density and input FUV flux.
- The extended and intense C I 609 um emission observed near H II regions can be explained by the inclusion of S and Si chemistry, C-atom self-shielding, and high C elemental abundance.
- They argued that C I should main exists on the surface of the dense molecular cloud.
- Important reactions in PDR:
(1) H2*: vibrationally excited H2. It is formed through electronically excitation by FUV photons and then followed by cascade and vibrationally excitation of H2. The H2* is abundant due to the forbidden transitions and the vibrational energy can help reduce the chemical barrier. H2* contribute to the formation of CH+ and OH.
(2) C I is formed at cloud edge mainly through C+ + e -> C + h nu and CH + h nu -> C + H, and at interior of clouds via charge transfer: C+ + S -> C + S+ and C+ + SiO -> C + SiO+.
(3) C -> CO conversion: C + OH -> CO + H; C + O2 -> CO + O near the C/CO transition region.
(4) However, CO is mainly formed through CH+O, CH2+O, SiO+C+, H2O+C+ and OH+C+ reactions.
(5) CO is mainly dissociated by FUV photons on the cloud surface, while in the deep cloud interor, it is detroyed by cosmic ray induced ion reactions: CO + He+ -> C+ + O + He and CO + H3+ -> HCO+ + H2.
(6) e: important for gas heating. it is controlled mainly by photoionization of C and S atoms and their recombination on the cloud surface, while in the interior of the cloud, c.r. ionization and H2 and He and photoionization of metals (Mg, Fe) are important and positive charged are largely locked up on metals.
- (Tielens & Hollenbach, 1985ApJ...291..747T)
Facts: They constructed a photochemistry model for Orion.
Results: The model successfully reproduced the observed O I 63 and 145um and C I 609 um and C II 158 um lines, low J rotational lines of CO, extended emission of H2 1-0 S(1), C recombination lines, and C I 9850 A lines. It also predicted observable emission lines of C I 370um, Si II 35um, and Fe II 26 and 35um. The model implies a uniform density of 10^5 cm^-3, peak temperature of 500K, FUV field G0~10^5 behind the Trapezium stars. The bright C I 609um line is emitted from the C+/C/CO transition region.
- (Sternberg & Dalgarno, 1995ApJS...99..565S)
Facts: They construct a detailed chemical model for dense PDR to explore the full atomic and molecular chemistry. The model is a plane parallel model with model parameters as follow:
density: nT = nH + nH2= 10^6 cm^-3,
FUV:
χ=2x10^5,
[O] = 6x10^-4 (solar),
[C] = 3x10^-4 (solar),
[S] = 1x10^-5 (solar),
[N] = 1x10^-4 (solar),
[Si] = 1x10^-6 (depleted),
[PAH] = 1x10^-7,
Turbulence Doppler width: b = 2.0 km/s,
Grain photoelectric threshold: B0 = 8.0 eV,
H2 1-0 vibrational critical density: 5x10^4 cm^-3.
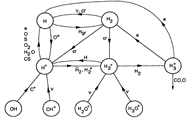
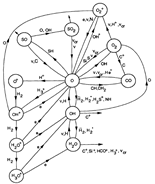
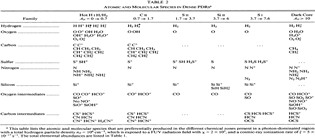
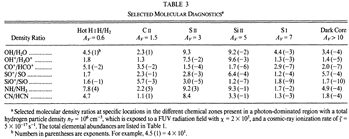
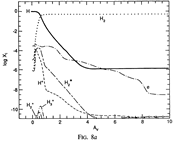
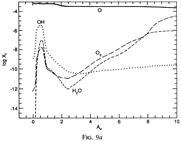
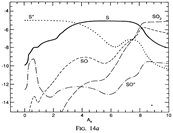
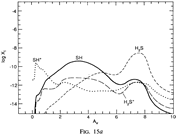
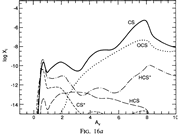
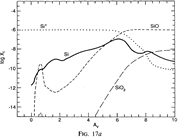
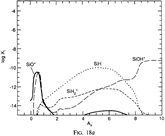
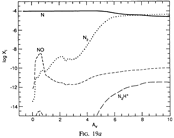
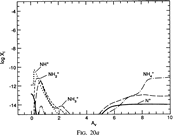
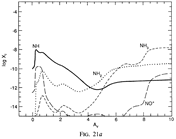
Results: They divide the PDR into several regions: Hot H I H/H2 region, C II, S II, Si II, SI, and dark core regions. They devide the species into several families: H, O, C, S, N, O itermediate and C intermediate families. They gave detailed dominant chemical reactions for different regions and different species and show the abundance distribution in plots.
--->
In the H I and H/H2 zones (Av = 0~0.7): The main form of the major elements are: H, C+, O, N, S+ and Si+. Further reactions are initiated by their reactions with H2. The chemistry is driven by photodissociation + photoionization;
---> In the C II (Av = 0.7~1.7) and S II (Av = 1.7~3.7) zones: Because the elemental abundance creases from H to C to S, the C II zone extends deeper than H I zone, and the S II zone extends deeper than the C II zone. The chemistry is driven by photodissociation + photoionization;
---> In the Si II (Av = 3.7~6.0) and SI (Av = 3.7~7.6) zones:
The chemistry is driven by photodissociation + photoionization + c.r. ionization;
---> Dark Core (Av > 10): The chemistry is driven by c.r. ionization of H and He.
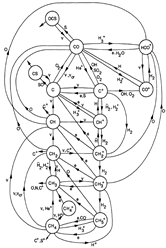
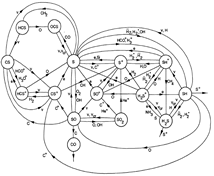
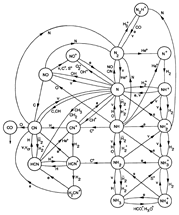
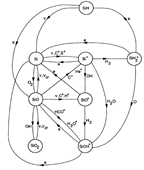
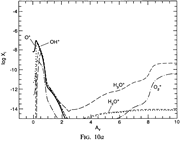
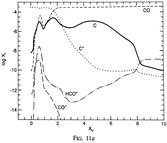
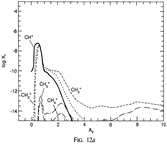
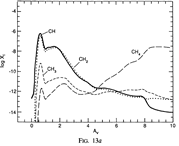
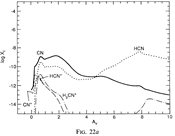
(figs: (top row): the chemical networks of H, O, C, S, N and Si;
(2nd row): left -- the ions and molecules in the dense PDR; right -- the selected diagnostics for the different layers of the dense PDR;
(bottom 3 rows): abundance profiles of species families of H, O, O+, C, C+, CH, S, SH, CS, Si, SiH, N, N+, NH, and CN, respectively.)
- Observations (back to top)
Shock Chemistry (back to top)
- (Jorgensen et al., 2004A&A...415.1021J)
Facts: They mapped the mm lines of the outflows associated with the low mass protostar NGC 1333-IRAS 2A down to 3" (650 AU) scales to study shock chemistry. They used OVRO, BIMA and CSO.
Results:
- The interaction of the highly collimated outflows with a molecular condensation 15000AU away is traced with HCN, SiO, SO, CS, and CH3OH.
- SiO traces a narrow high velocity component at the interface.
- With the multiple transition observation with single dish, they defferentiate the emission from the outflow and the molecular condensation. They find that
- Trot = 20 K in the quiescent cloud but = 70K in the shock component;
- CH3OH, SiO and S-bearing species have their abundances enhanced by 2-4 order of magnitude in the shocked component (high velocity component);
- HCO+ is seen only in the post-shock regions (the high velocity, shocked component);
- N2H+ showes narrow lines, coming from the quiescent component;
- Different abundances of HCN, H2CO and CS are seen in different outflow regions, which could be resulted from different C-atom abundances.
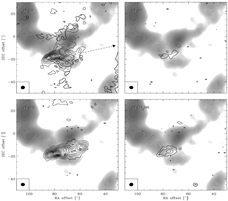
(figs: left -- maps of a) CS, b) SO, c) SiO and d) CH3OH overplotted upon low-velocity N2H+ grey-scale map; (dotted contour = low vel of 5-9 km/s; full line contour = high vel of 9-16 or 9-25 km/s)
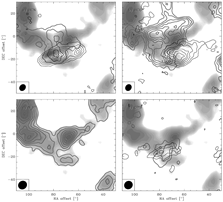
right -- maps of a)HCN, b) HCO+, c) N2H+ and d) C34S. )
- (Walmsley et al., 2005IAUS..231..135W)
Two kinds of shocks: C-type shock (continum shock) and J-typt shock (jump
shock). A shock usually first appears as a J-type shock, then soften to
a C-type shock. The high temperature and high density in the post-shock
gas can destroy molecules and dust grains and induce new non-LTE
chemistry.
- The water Conumdrum: above a
temperature of 250 K in the post-shock gas will converts all oxygen
into H2O, and for shock velocities above 25 km/s, ice mantles of
grains become eroded to produce H2O gas. But the observed H2O
abundance in shock regions is much lower than expected.
-
Grain erosion: only SiO was detected
in shock regions in jets, not other refractory elements have been
detected yet. Why?
|
| |
Object related astro-chemistry
(back to top)
- Circumstellar chemistry :
(back to top)
- (Millar, 2008Ap&SS.313..223M)
He summarized the chemistry in circumstellar
medium.
-
LTE chemistry close to the
photoshpere:
-
C stars: the most abundant
species are H2, CO, N2, C2H2 and HCN;
-
M stars: the most abundant
species are H2, H2O, and CO
-
Dust nucleation:
-
Shock waves help heat up and compress gas to allow grain
growth in the post-shock region, which is otherwise difficult
due to the fast fall of gas density according to r^-2.
-
Dust nucleates at about 5 R*.
-
In C stars, dust grain may be formed through the build-up of PAH following a pulsation shock. (Cau,
2002)
- Shock chemistry:
-
Chemistry on period of shock occurs in three steps: heats up to destroy molcules, cools down to reform molecules, freezes out the abundance pattern.
Several such shock periods may be experienced before freez-out.
The abundance can be very different after each shock period.
-
HCN and CS will be destroyed in shock chemistry, whilst SiO be enhanced.
(Willacy & Cherchneff, 1998)
-
Shock chemistry in O-rich stars: HCN, CS and CO2 can be enhanced by 8, 3 and 3 orders of magnitude,
respectively. (Duari et al., 1999)
-
Shock chemistry in S-type stars: HCN can be enhanced by 4 orders of magnitude. (Duari &
Hatchell, 2000)
-
Photochemistry: (Organic in C stars
only)
-
The most abundant species, H2 and CO, are stable, thus it is
the photodissociation and photoionization
of C2H2 that dirves the extensive organic
chemistry through both ion-neutral and neutral-neutral
reactions.
-
CnH with even number of C is more
abundant than one with odd number of C, because of the reactions
are mainly driven by C2H and C2H2+.
-
HCnN shows a decrease of
abundances and a increase of peak abundance radius towards
longer chains, because they are built up step by step.
-
Anion with six or more atoms can
be easily form through radiative electron
attachment. It usually results in dissociation of the
molecules. E.g., C6H- has been
detected in IRC +10216 by McCarthy et al., (2006). C4H- could also be detectable due to the
high column density of C4H (Millar et al., 2007).
- Metal chemistry:
- Metal halides such as NaCl, KCl,
AlCl, AlF should present in the LTE chemistry.
-
Metal cyanides or isocyanides like MgCN, MgNC, AlNC, SiCN and SiNC are observed at a far
distance from the central star, and thus should be formed by gas-phase reactions or some desorption process from the grains. E.g.,
the reaction of Mg+ with HCnN (particularly HC7N) followed by
dissociative recombination with electrons can form MgCN and MgNC
efficiently.
- (Papoular, 2008arXiv0808.2790P)
He find that the reaction of C + H => CH
should be much more efficient than generally assumed to produce
observed abundance of CO gas in the photosphere of an carbon star. The formation of CH is important for
the formation of CO.
- Circumstellar Isotopes
(back to top)
- Wannier and Linke, 1978ApJ...225..130W discussed isotopic ratios of D, 13C, 15N, 17O, 18O, and 34S through mm observations of isotopically substituted species of CO, CS and
HCN in IRC+10216. (to be read in more
detail...)
-
Wannier et al., 1991ApJ...380..593W observed (sub)mm lines of HCN and HC3N and determined double ratio (14N13C)/(15N12C) for 8 carbon stars. Using known 13C/12C ratios, they found that the
14N/15N ratio in 6 of them are larger than solar value (272), which
indicates CNO processing of material.
-
Cernicharo et al., 1986A&A...167L...9C observed 404-303, 423- 322 and 422-321 lines of 29SiCC and 30SiCC in IRC+10216, confirmed the
detection of the two species, and found the abundance ratio of 29SiCC:30SiCC:Si13CC to be very close to the terrestrial values.
-
Interstellar Isotopes
(back to top)
- (Penzias, 1983ApJ...273..195P)
Mapping of millimeter lines of CO, 13CO and C18O to two giant molecular clouds allows him to study the velocity and spatial
dependence of 12C/13C ratio. He found that 13C abundance determination is more subject to chemical enhancement effects than
previously thought. Newly determined 12C/13C =
100+-14.
-
(Henkel et al., 1985A&A...143..148H)
Using the measurement of H2CO towards 6 source in the inner Galactic disk (5kpc<R(GC)<8kpc),
they determined an average 12C/13C ratio of 50, roughly 1/2 of the local value, which indicates stellar evolution effect in the inner disk.
-
(Hawkins & Jura, 1987ApJ...317..926H)
Optical observations of CH+ towards four sight lines with distinct physical conditions show uniform (within 12%) 12CH+/13CH+ ratio of about 43+-4 precludes the fractionation or selective photodissociation effect of CH+.
-
(Boreiko & Betz, 1996ApJ...467L.113B)
The infrared fine and hyperfine lines of 12C II
and 13C II are resolved to the PDR of Orion using heterodyne spectrometer and their opacity are acurrately
determined. The derived 12C/13C = 58 +6-5.
It agrees well to CO measurements, but higher than IR measurements of C
II.
-
(Takano et al., 1998A&A...329.1156T)
They observed HC3N, H13CCCN, HC13CCN and HCC13CN towards TMC-1 using
the J=2-1,; 4-3, and 5-4 rotational transitions at 18, 36, and 45GHz, respectively.
They found that [H13CCCN] : [HC13CCN] : [HCC13CN] = 1.0:1.0:1.4. The over abundance of HCC13CN
(13C isotopic
fractionation) can be explained if the neutral-neutral gas reaction between C2H2 and 13CN is important.
-
(Boogert et al., 2000A&A...353..349B)
They use the ISO SWS spectra to study the stretching mode of 13CO_2 ice along 13 lines of sight in the Galaxy.
They determined for the first time the 12C/13C ratio from the solid state to be
69+-15, agree to gas phase values.
-
(Savage et al., 2002ApJ...578..211S)
With the accurate determination of opacities using millimeter CN hyperfine structure lines, they determined
reliable 12C/13C ratio to 13 Galactic
molecular clouds. The values are in 20~70 range,
with a noticeable gradient with GC distance.
The highest values are associated PDR where isotope-selective
photodissociation is active. The 12C/13C ratio in the solar neighbourhood is about one half of the solar value, indicating enrichment in the 4.6 Gyr
histroy.
-
(Milam et al., 2005ApJ...634.1126M)
Combining many CN line data, they
concluded that 1) C isotopic ratio gradient with GC distance is found : 12C/13C
= 6.21 * D(GC) + 18.71; 2) The gradient is found to be
consistent among measurements of three molecules CO, CN and H2CO,
indicating no fractionation and selective
photodissociation effect; 3) The appanent discrepancy between solar ratio (89)
and local interstellar ratio (~68) could be caused by 13C enrichment since the formation of the solar system.
-
(Sheffer et al., 2007ApJ...667.1002S)
They use HST to determine the interstellar 12CO and 13CO column density ratios through their UV A-X absorption lines. For most of the sight lines, the 12CO/13CO ratio is not too different from the local value of 70 (in the range of 35-140). Lower 12CO/13CO values were found
to 25 sight lines, indicates fractionation effects overtaking selective photodissociation effects.
-
(Sonnentrucker et al., 2007ApJS..168...58S)
They use UV spectra obtained by FUSE, HST and/or IUE to determine the column densities of CO, 13CO and/or C2 for 10 Galactic
sight lines with E(V-V) ranging from 0.37 to 0.72. They found that sight lines with 12CO/13CO ratios lower than local Galactic
value appear to sample denser, colder gas in which isotopic fractionation can occur.
- (Stahl et al., 2008A&A...477..865S)
They use the CH+ absorption line to determine average and variation of interstellar 12C/13C ratios, in order to shied light on stellar yields. They found an average ratio of 76.27+-1.94 (in the range of 43.7-146.7). The scatter of the ratio indicates chemical inhomogeneity in ISM.
- Chemistry in IRDCs
(back to top)
- (Vasyunina et al., 2010arXiv1012.0961V)
Facts: They observed 13 molecular species in 86-93 GHz range toward 15 IRDCs in the southern sky using 22-m MOPRA telescope. 13 molecular species are observed. They detected HCN, HCO+ and HNC line in all clouds and N2H+ in all but one cloud. All clouds show complex HCO+ line profiles.SiO line is detected in some clouds.
Opinions: The IRDCs already possess infall and outflow motions and star formation has started inside. The molecular abundances of IRDCs look more similar as low mass pre-stellar cores, instead of massive prostellar objects, at least in their single dish beam.
Chemistry of individual species (back to top)
- ----------------- HCO+ --------------- (back to top)
- (Mitchell & Deveau, 1983ApJ...266..646M)
Passage of a non-dissociative shock of 10km/s through an diffuse interstellar cloud of initial density of 100 cm^-3 induces chemistry. The pre- and post-shock column densities are listed in a table. Also given are time evolution curves of those evolving species. The enhancement of HCO+ in the postshock gas of SNR IC 443 is due to high abundance of C+ in the preshock cloud.
- (Turner, 1995ApJ...449..635T)
A survey of HCO+ and N2H+ in 11 cirrus cloud cores and 28 translucent objects showed that HCO+ 1-0 was seen in all objects while 3-2 line was seen only in a few localized regions. HCO+ abundance is higher in optically thin clouds than in denser clouds, in accord with the major photo-chemistry path of the HCO+ formation. N2H+ was detected only in two densest objects, because it can be formed only by dense-cloud processes.
HCO+ is mainly produced through C+ + OH -> CO+ + H and CO+ + H2 -> HCO+ + H and destroyed through HCO+ + e -> CO + H in translucent clouds. (different from dense clouds, see in the work of Savage & Ziurys, 2004, below.)
- (Hogerheijde et al., 1997ApJ...489..293H)
Mapping of HCO+ and H13CO+ lines towards 9 low mass YSOs reveals 2/3 of them with compact disk only (point continuum sources) and 1/3 of them with envelope (extended continuum sources). HCO+ 1-0 line is found to trace surrounding clouds, while 3-2 and 4-3 lines trace the central source better. HCO+ is a better tracer of embedded YSOs than 1.1um continum and CS because the continum can originate from compact disk and CS traces surrounding clouds. A abundance of [HCO+]/[H2]=1.2(+-0.4) x 10^-8 was derived from model fitting. The intT_hco+/Lbol is a good tracer of evolutionary stages of the low mass YSOs.
- (Rawlings et al. 2000MNRAS.313..461R)
Radiative transfer modeling of observed HCO+ line strengths always give an order of magnitude higher HCO+ abundance (~10^-8) than predicted by reliable chemical model (~10^-9). They proposed the formation of additional HCO+ on the wall of collimated outflows to account for the excess of HCO+. The shocks of the outflow desorb simple molecules from grains and the intense UV radiation produced in the shock fronts can drive the photochemistry to produce much HCO+. A detailed chemistry model was presented. It also indicates that more complex model than spherical quiescent clouds is required to interpret the profile and morphology of the HCO+ lines, particularly in low mass SFRs in which collapse motion is invariably accompanied by collimated outflows.
- (Savage & Ziurys, 2004ApJ...616..966S)
Facts: They detected HOC+ and CO+ line in two well known PDRs, S140 and NGC 2023. The abundance ratio [HOC+/CO+] is near constant. However, the [HCO+/HOC+] ratio is not small enough for PDRs.
Conclusions: The HOC+ and CO+ chemistry is connected with each other through C+ in the PDRs. Observations of [HCO+/HOC+] ratio could be affected by poor spatial resolution.
HCO+ is mainly produced through H3 + + CO -> HCO+ + H2 and destroyed through HCO+ + e -> CO + H in dense clouds (this reaction also produces some HOC+, but not more than 10% of observed HOC+.)
in PDR:
CO+ can be produced by C+ + OH -> CO+ + H and C+ + O2 -> CO+ + O;
HOC+ can be produced by C+ + H2O -> HOC+ + H and CO+ + H2 -> HOC+ + H;
- ----------------SiO---------------- (back to top)
- (Ziurys et al., 1989ApJ...343..201Z)
They obsreved J=2-1 line of SiO in several hot and cold molecular clouds. SiO was not detected in dark clouds down to column density limits of 2-4x10^10 cm^-2 while SO and SO2 are readily detected, indicating SiO/SO < 1/1000 and SiO/SO2 < 1/1000 (in contrast to [SiO/SO] ~ 1 in Orion KL). However, it was detected in all sources with Tk > 30 K, with the largest Ncol ~ 10^13-10^17 cm^-2 measured in the warmest clouds with Tk > 100 K. The SiO column density was estimated by adopting Tk found from other molecules. Relative abundance of SiO can not be readily obtained, because it has quite different excitation conditions as CO lines; thus [SiO/HCN] is used. Spatially extended SiO distribution in NGC 7538 might originates from multiple sources, instead of from quiescent clouds. A natural log linear relation is found between the SiO abundance and Tk: ln([SiO/HCN]) ~ exp(-86K/T), which indicates that the formation of SiO in these regions has an energy barrier of ~ 90K.
- The production of SiO in high temperature gas should not be due to gas phase reaction Si + OH, because the activiation energy to produce OH in shocked gas is 9000K, instead of 90 K; other gas phase chemical paths, such as the dissociative recombination of HSiO+ and the SiH + O => SiO + H, are largely unknown.
- An alternative pathway is the grain destruction in hot gas. However, the characteristic energy barrier of 90 K and the lack of Mg-bearing species (silicates is mainly composed of MgSiO3) in the SiO abundant regions pose questions to this interpretation. The enrichment of SiO over HCN with increasing Tk itself also questions the grain evaporation pathway, because HCN is also volatile and thus should be enriched through grain destruction.
- (Herbst et al., 1989A&A...222..205H)
Gas phase chemistry of Si in dense interstellar clouds are investigated. For a dark cloud with T = 10K, n(H2) = 10^4 cm^-3, a very large depletion (upto ~ 10^7) of Si is required to reproduce observed abundances of < 2x10^-12. The previously known difficulties with grain evaporation mechanism (e.g., energy barrier of 90K, lack of Mg-bearing species, the possible variation of HCN due to grain desorption) do not exist, because only a very small grain mantle evaporation (0.1%) is needed to raise the SiO abundance, while it is too small to affect the abundance of Mg- and N-bearing species. The [SiO/H2] = 3.7x10^-8 for the dark cloud model (with an Si elemental abundance of 4x10^-8, or a depletion factor of 10^3, and other quantitites typical for TMC-1) in either early state or steady state. When the gas phase Si elemental abundance is varied, the SiO abundance responds to the change linearly.
- (Martin-pintado et al., 1992A&A...254..315M)
From the IRAM 30m observation of millimeter lines from some molecules and multiple transitions of SiO in several molecular outflow sources L1448, B1, NGC 2071, and Cep A, they found that the broad SiO line profiles are distinct from other species, indicating two components in the star: quiescent gas characterized by narrow lines and shocked gas characterized by broad SiO lines. The SiO abundance was found to be [SiO/H2]< 4x10^-12 in quiescent clouds, but be greatly enhanced (by up to 10^6) in high velocity shocked gas, indicating the release of Si from the partially destroyed grains in the shocked regions. The [SiO/H2]~2x10^-6 at high velocity in L1448, indicating that ~3% of Si is in the gas phase.
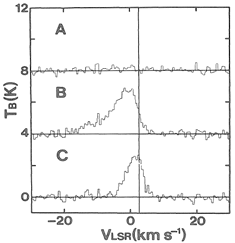
(figs: Left to right -- Spectra of SiO and other species of cold clouds L1448 outflow (IRS3) and dark cloud B1, warm clouds NGC2071 and Cep A)
   
- (Mikami et al., 1992ApJ...392L..87M)
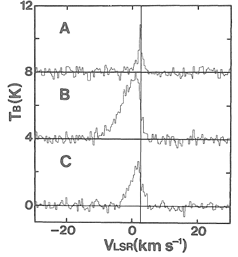
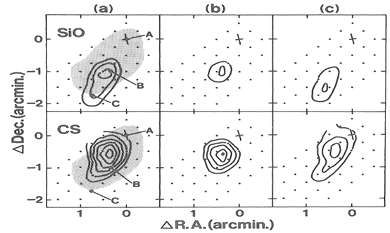
They observed thermal SiO, v=0, J=1-0 and 2-1 lines from a low mass SFR, L1157. Only the blue component was detected in the blue shifted lobes of the outflow. The high SiO enhancement in the outflows indicate shock chemistry to produce the SiO possibly via dust sputtering.
(figs: left -- SiO 2-1 spectra at three positions define in right figure; middle -- CS 2-1 lines at the same 3 points; right -- maps of SiO and CS 2-1 lines in different Vlsr interval: (a) -5 ~ +5 km/s, (b) -5 ~ 0 km/s; (c) 0~ +5 km/s, with Vsys = 2.7 km/s.)
- (Mackey, 1995MNRAS.274..694M)
They assume hydrogenated species SiH4 is the main source of Si reservoir in the grain mantles and studied the evaporation of the grain icy mantles in hot cores and its effects on subsequent gas phase chemistry. SiO, H2SiO, HNSi and SiH4 can be produced with large fractional abundances in the gas.
- (Avery & Chiao, 1996ApJ...463..642A)
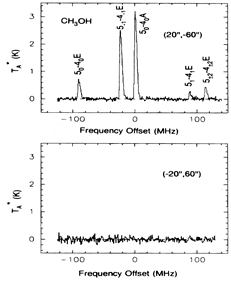
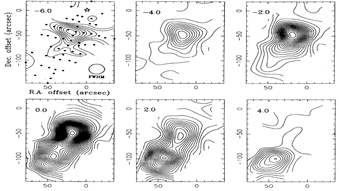
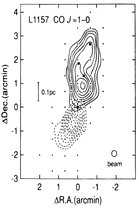
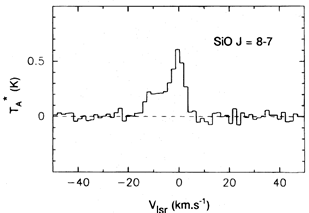
Both SiO and CH3OH are found to be highly enhanced in the remarkable outflow source L1157. They originate from warm regions. SiO in high velocity component is enriched by ~10^5 w.r.t. dark cloud value, and enriched by ~10^6 in lower velocity components. CH3OH is also sublimated from the grains in warm gas with Tkin > 100K, which resulted in an observed abundance of [CH3OH/H2] = 1.5x10^-7. However, both species could be short lived, because they could be re-adsorbed onto grains when the temperature drops down. The higher enrichment in the lower velocity component of SiO line could be due to dissociation of more SiO in the faster shock regions. The lack of SiO and CH3OH emission in the red wing, indicate different chemical processes in the two components. If the CH3OH abundance is greatly enhanced, it could mean that the grain evaporation process is relatively gentle and associated with a specific temperature range (around 120-130 K), because CH3OH can be easily dissociated in higher temperature and difficult to make with gas phase ion-molecule reactions.
(figs: left -- spectral plots of CH3OH lines at the south blue lobe (upper) and north red lobe (lower); middle left -- channel maps of CH3OH 5_0-4_0 A+ line at the blue lobe showing velocity gradient upstream along the outflow axis; middle right -- CO 1-0 map of the blue (broken lines) and red (solid lines) lobes, the Vsys = +2.7 km/s; right -- spectral plot of SiO line)
- (Schilke et al., 1997A&A...321..293S)
From the chemistry modeling of charged grain sputtering by neutral particles (mainly those heavier than He) in a C-type shock (shock velocity 10 km/s < Vs < 40 km/s, pre-shock density 10^4 cm^-3 < n0 < 10^7 cm^-3) , they found that, for a shock velocity of Vs = 25 km/s and a pre-shock density of n0 = 10^5 cm^-3, the generated SiO column densities from both grain cores and mantles erotion are similar to observations of SiO lines in molecular outflow regions. The modelled abundance [SiO/H2] = 10^-6 ~ 10^-7. Si may exist in the grain mantles in the form of SiH4, SiO2, etc, rather than SiO. In their model, they considered sputtering of grain cores and mantles, dissociation of neutral molecules in collision with charged grains, and new routes of SiO formation reactions. They also gave LVG simulation of line profiles that qualitatively agree with observed SiO line profiles.
- (Caselli et al., 1997A&A...322..296C)
In a C-type shock, grain-grain collision and sputtering can release Si and H2O into gas phase. Grain-grain collision will dominate over sputtering the production of SiO when n(H) > 5x10^5 cm^-3 and 25 km/s < Vshock < 35 km/s, and the production of H2O when n(H) > 10^6 cm^-3 and Vshock < ~15 km/s. The two mechanisms can enhance SiO abundance in the shock by more than 1000 times.
- (Lefloch et al., 1998ApJ...504L.109L)
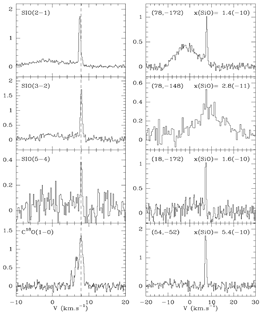
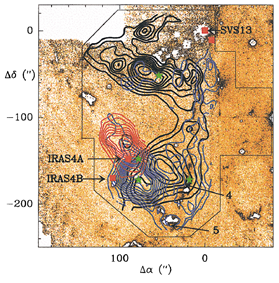
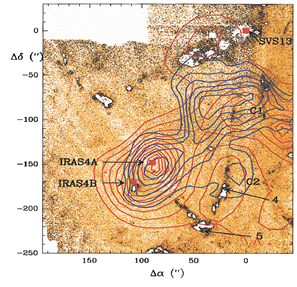
NGC 1333 is nearby molecular cloud (d=350 pc) with a burst of low-mass star formation. They observed SiO 2-1, 3-2, 5-4 for the first time using IRAM 30m.
(figs: left -- SiO spectra at different locations; middle -- SiO contour maps overlapped on the top of H2 2.12um intensity grayscale map (black contours are quiescent SiO components); right -- CS 5-4 (red) and H13CO+ blue contour maps overlapped on H2 grayscale map.)
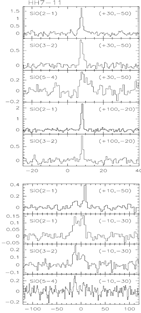
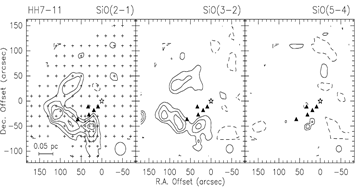
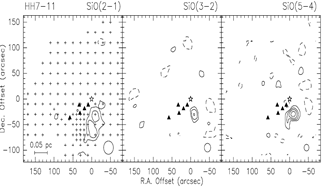
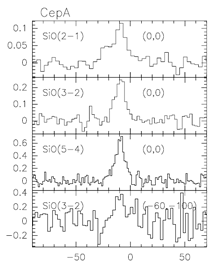
- (Codella et al., 1999A&A...343..585C)
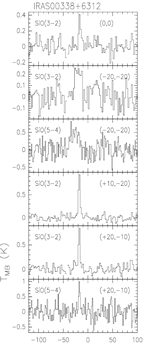
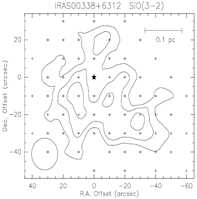
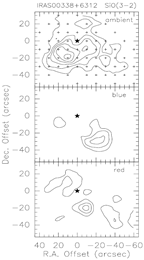
From the observation of multiple SiO transitions towards a sample of HH objects, they found various SiO line profiles. Some sources show narrow SiO line that could be interpreted by (1) decelarated post-shock gas in which SiO has not been completely depleted onto grains or (2) existence of slow shocks and Si in grain mantles. Broad and narrow components are usually from different spatial locations. The SiO abundance is only about 10^-11-10^-10 in the low velocity componens, but be about 10^-9-10^-8, say, two orders of magnitude higher in high velocity components.
(figs:
upper row: the example of IRAS 00338+6312: left -- SiO spectral line profiles; middle -- integrated SiO 3-2 map; right -- difference velocity components of the SiO 3-2 map.
middel row: the example of HH7-11: left -- SiO spectral line profiles; middle -- maps of the narrow SiO components; right -- maps of the broad SiO components.
Lower row: the example of Cep A: left -- SiO spectral line profiles; right -- maps of the SiO lines. )
 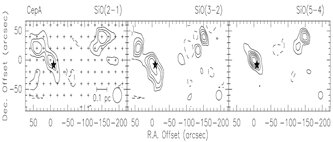
- (Garay et al., 2000ApJ...545..861G)
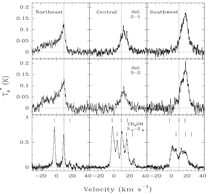
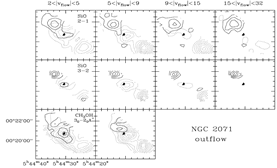
They mapped SiO and CH3OH lines in NGC2071 using SEST. They found quite different SiO line profiles towards the tow outflow lobes, which can be explained by different shock velocities resulted from different ambient cloud densities. The red-shifted south component show the peak near the most red shifted velocity, perhaps because the shocks are slower and nondissociative bow shocks and thus the SiO is mainly produced near the apex of the shock. The blue-shifted north component shows broad line and a strong peak near ambient cloud velocity, perhaps because the shocks are faster dissociative bow shocks and thus SiO is mainly produced in the weak of the bows.
(figs: left -- SiO and CH3OH line profiles; right -- channel maps of SiO and CH3OH lines.)
- (Chandler & Richer, 2001ApJ...555..139C)
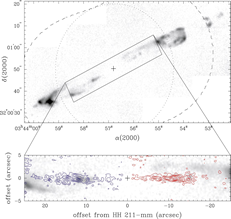
From the VLA mapping of SiO 1-0 in HH 211, they find that the SiO mainly appears in the internal working surfaces of the jets.
(fig: H2 and SiO images of HH 211.)
- (Le Picard et al., 2001A&A...372.1064L)
They propose that the Si(3P_J) + O_2 -> SiO + O reaction is faster enough to produce some SiO. The reaction rate is 1.72x 10^-10 (T/300 K)^-0.53 exp (-17 K/T) cm^3 molecule^-1 s^-1 in the temperature range 15-300 K.
- (Gibb et al., 2004ApJ...603..198G)
They observed SiO 5-4 towards a sample of outflow sources and detected it mostly in Class 0 objects, but seldom in Class I and II objects. The detection rate is only 28% (7 out of 25). They determined the LTE abundance of SiO to be 10^-8~8x10^-7 using the formula from Irvine et al. (1987): N_SiO = 2.5x10^12 int[Tmb]dv.
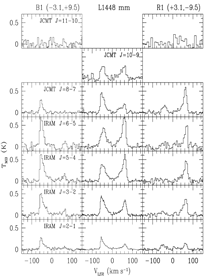
- (Nishini et al., 2007A&A...462..163N)
Using IRAM and JCMT, they observed multiple transitions of SiO (Jup = 2-11) to two Class 0 shock sources: L1448 and L1157. They found that the SiO line ratios can be well interpreted by ND-shock model, while the model predition of progressively broadening of SiO line width towards larger Jup was not observed, because all SiO lines show the same line width. The physical properties are:
....L1448: n ~ 10^6 cm^-3, Tkin > 500K at B1 and R1, n = 2.5x10^5 cm^-3, Tkin = 200K at R4;
[SiO/H2O] = ~(2-3)x10^-4
....L1157: n ~ (1-5)x10^5 cm^-3, Tkin ~ 100-300K;
[SiO/H2O] = ~10^3.
(figs: left -- multiple transitions of SiO in L1448; right -- that in L1157.)
- (Beuther & Sridharan, 2007ApJ...668..348B)
They surveyed SiO 2-1, CO 2-1, 13CO 2-1 and NH3 (1,1) in a sample of 43 massive dark clouds. SiO was detected in 40% sources, CH3OH was also detected in about 40% targets. They mentioned that the adsorption lifetime of SiO of 10^4 yr does not make sense in explaining the SiO line peak near systemic velocity in some of their starless core, because the massive star formation time scale is as short as 10^5 yr and, after 10^4 yr of formation, a MYSO should become detectable at IR. They propose SiO gas before acceleration to explain this.
- (Gusdorf et al., 2008A&A...482..809G)
An improved physio-chemical model of SiO in ND-shocks is present. The model includes: (1) dynamics of (negatively) charged grains, (2) radiative cooling by H2 (solve H2 excitation, hydrodynamics and chemistry in parallel), (3) include charged PAH as very small grains to raise the magnetosonic wave speed to allow higher shock speed, (4) allow a grain size distribution, (5) improved treatment of the erosion of olivine grains. The three main reactions related to the production and destruction of SiO are:
...Si + O2 = SiO + O
...Si + OH = SiO + H
...SiO + OH = SO2 + H
They find that the shock front is thinner than previously though, and thus resulted in less cooling by H2 and thus high postshock gas temperature that entails different chemistry. They studied a grid of models with Vs = 20-50 km/s, 10^4 < n0 < 10^6 cm^-3. Lower fraction (<10%) of Si can be released from grain erosion which occurs significantly only when Vs > 25 km/s. The observed SiO line ratios in L1448 and L1157 can be well reproduced, and the SiO abundance was found to be 4x10^-8 < [SiO/H2] < 3x10^-7. They also intented to explain the observed narrow SiO spectral peak at the systemic velocity as from SiO gas either decelerated by reverse shocks from dense interstellar clouds ahead of the shocks or left behind by older bullets in episodic shock events.
- (Guillet et al., 2009A&A...497..145G)
They found that J-type shocks slower than 50 km/s can also explain the observed enhancement of SiO abundance through grain evaporation (but not grain sputtering).
- ----------------CH3OH---------------- (back to top)
- (Friberg et al., 1988A&A...195..281F)
Facts: The CH3OH thermal lines were observed for the first time towards three dark cold clouds (TMC 1, L134 N, B335) using the FCRAO 14m antenna. The abundance [CH3OH/H2] = 0.5~2x10^-9.
Opinions: The similar abundance of CH3OH in different dark clouds with varying carbon chain molecules can not be explained by current chemistry models. CH3OH line excitation is generally non-LTE in these dark clouds, with the lowest transition superthermal w.r.t. the higher transitions. (optical depth is not favored for explaining the observed abnormal line ratios of A-type methanol.)
- (Blake et al., 1991Sci...254..548B)
Facts: They did experiments in vacuo to study the evaporation of hydrates from icy grains to form clathrate around the grains in comets.
Opininions: They found that CH3OH may evaporate at a temperature of ~ 120K and form clathrate to protect smaller volatiles in porous textures of the grains for latter release when the comet temperature is elevated at a closer distance to the sun. This effect might also play some role in star formation clouds.
- (Menten, 1991ApJ...380L..75M)
Facts: They detected extremely strong 6.7GHz CH3OH maser in a number of star forming regions for the first time, using the 140 foot (43m) telescope. They are associated with interstellar OH masers and 12GHz CH3OH masers and thus belong to class II CH3OH masers. They are very strong, exceeding the flux of all known OH masers. However, this line is in absorption in class I CH3OH maser regions.
Opinions: There are two kinds of methanol masers: Class I -- those offset from UC HII and OH masers and arise when outflows interact with ambient high density gas; Class II -- those associated with UC HII regions and OH masers. Both class has several transitions and they never appear simultaneously in the same region (but can exist in the different regions of the same object).
- (Helmich et al., 1994A&A...283..626H)
Facts: JCMT was used to observe SO2, CH3OH and H2CO in three positions (IRS4, IRS5 and W3(H2O)) of the star forming cloud W3. T_k was found to be ~220K in W3(H2O), ~100K in IRS5 and ~55K in IRS4. H2 Densities are 10^6 cm^-3.
Opinions: W3IR5 is probably in the youngest stage, with only weak continuum emission, an outflow with dynamical age of (1-3)x10^4 yr and strong SO2 lines and weak CH3OH lines that resembles Orion Plateau. The chemical composition of W3(H2O) with strong CH3OH lines resemble that of hot cores, with a dynamical age possiblely of ~10^5 yr. The W3 IRS4 is in a more evolved stage where stars have formed and the cloud chemistry has returned to quiescent cloud case, like the Orion Ridge.
- (Avery & Chiao, 1996ApJ...463..642A)
Facts: Both SiO and CH3OH are found to be highly enhanced in the remarkable outflow source L1157. SiO in high velocity component is enriched by ~10^5 w.r.t. dark cloud value, and enriched by ~10^6 in lower velocity components.
Opinions: They originate from warm regions. CH3OH is also sublimated from the grains in warm gas with Tkin > 100K, which resulted in an observed abundance of [CH3OH/H2] = 1.5x10^-7. However, both species could be short lived, because they could be re-adsorbed onto grains when the temperature drops down. The higher enrichment in the lower velocity component of SiO line could be due to dissociation of more SiO in the faster shock regions. The lack of SiO and CH3OH emission in the red wing, indicate different chemical processes. If the CH3OH abundance is greatly enhanced, it could means the grain evaporation process is relatively gentle and associated with a specific temperature range (around 120-130 K), because CH3OH can be easily dissociated at higher temperature and difficult to make with gas phase ion-molecule reactions.
(figs: left -- spectral plots of CH3OH lines at the north blue lobe (upper) and south red lobe (lower); middle -- channel maps of CH3OH 5_0-4_0 A+ line; right -- spectral plot of SiO line)
  
- (Takakuwa et al., 1998ApJ...501..723T)
Facts: They mapped TMC-1C region in H13CO+ 1-0 and CH3OH 2_0-1_0 A+ with the 45m Nobeyama telescope. They found that almost all H13CO+ cores are offset from all CH3OH dense cores, with typical core sizes of 0.07 pc for both lines.
Opinions: They concluded that the H13CO+ cores are in a chemically later evolutionary stages than the CH3OH cores. (how about opacity effect in CH3OH lines?)
- (Turner, 1998ApJ...501..731T)
Facts: He surveyed CH3OH in 27 translucent cores (cirrus cores or Clemens-Varvainis translucent cores) using the NRAO 12m telescope and detected it in 17 of them, favoring those with large extinction. Excluding several sources with high abundances, the mean [CH3OH/H2] = 3x10^-9 for the rest sources.
Opinions: The gas phase chemistry of CH3OH is simple: CH3+ + H2O => CH3OH2+ + hν, followed by electron recombination. However, the abundance predicted from the gas phase chemistry model is 4 order of magnitude lower than observed values. Grain surface chemistry in which CO hydrogenates into CH3OH together with very low desorption efficienies can explain the observations. He also discussed the excitation of CH3OH and the abundance ratio of the A and E type lines in detail.
- (Dartois et al., 1999A&A...342L..32D)
Facts: UKIRT was used to observe the solid state absorption lines of H2O and CH3OH in L band (3.54, 3.84 and 3.94 mu) in two high mass protostars RAFGL7009S and W 33A. The [CH3OH/H2O] ratio is large: 30% in RAFGL7009S and 5~22% in W 33A.
Opinions: CH3OH is the second abundant species on the icy grain surface after H2O. The solid CH3OH seems to be more abundant in the grain mantles near the vicinity of high mass protostars.
- (van der Tak et al., 2000A&A...361..327V)
Facts: JCMT and OVRO were used to observe CH3OH and H2CO line series towards 13 MSFRs to study the chemistry. Trot = 30~200 K for CH3OH, but only 60~90 K for H2CO. Trot(CH3OH) is tightly corelated with Tex(C2H2) from IR data. CH3OH line width is typically 3-5 km/s, except for two low luminosity sources GL 7009S and IRAS 20126 whose line shape indicates outflows.
Opinions: CH3OH and C2H2 are collocated in these regions. Only in low luminosity sources, CH3OH desorption can be dominated by shocks. There are three types of abundance radial profiles in these SFRs: flat profile with [CH3OH/H2] ~ 10^-9 in the coldest sources; jump profile with [CH3OH/H2] jumps (at T=100K) from 10^-9 to 10^-7 towards the center of warmer sources; flat profiles with [CH3OH/H2] ~ 10^-8 in hot cores. H2CO can be fit by constant abundance model of 10^-9 in all sources. Trot (CH3OH) can be used as an evolution indicator during embedded phase of massive SF. CO is primarily reduced into CH3OH at n_H<10^4 cm^-3, but oxidized into CO2 at higher densities. They mentioned the evaporation temperatures of several species:
H: 10-15 K
CO: 20 K
H2O: 90 K
CH3OH: 90 K
- (Cragg et al., 2002MNRAS.331..521C)
Facts: They modelled class II CH3OH masers (6.7 GHz) and OH mainline masers (1665GHz) in massive star forming region simultaneously for the first time. If both masers are radiatively pumped, they have common conditions of maser pumping and thus explain the cospatial distribution of them in observations.
Opinions: CH3OH and OH masers can be used to indicate the evolutionary stages of early massive SF, with CH3OH favoring the earlier stages. After the developement of H II region, both will dissappear. Those regions with only one of the two masers should be chemically different from those regions show the two masers simultaneously, because the maser pumping conditions are similar. In many sources where both masers show similar brightness temperature, CH3OH abundance should be 2-100 times higher than OH, while sources with stronger OH maser tends to have moderate CH3OH abundance and sources with stronger CH3OH maser should have lower OH abundance or higher gas temperature outside of the OH maser regions.
- (Maret et al., 2005A&A...442..527M)
Facts: IRAM 30m and JCMT were used to observe CH3OH lines in a sample of class 0 low mass protostars. With an abundance jump model, they find the CH3OH abundance in class 0 protostars to be 3~20x10^-10 in the outer envelope (comparable to the value of 5x10^-9 in dark clouds) and be enhanced by two orders of magnitude in the inner envelope (closer to hot core values of 1~7x10^-7). The CO, H2CO and CH3OH abundance ratios agree with grain surface chemistry models, while the absolute abundances are hard to reproduce.
Opinions: The formation of CH3OH in gas phase at a temperature of 10K is inefficient, while the formation of it on grain ice mantle through successive hydrogenation of CO is fast at low temperatures. However, the much higher CH3OH abundance of 0.2~2x10^-5 in ice indicates partial ice mantle evaporation. In hot regions, CO, H2CO, CH3OH, H2O all will evaporate from the icy grain mantles, but the evaporation temperatures of them are different. If the CH3OH is trapped in H2O ice, its evaporation temerature is 90K; if it is trapped in CO ice, the evaporation temporature is 30K.
- (Purcell et al., 2009MNRAS.394..323P)
Facts: Morpra antenna was used for 3-mm line survey to a sample of 83 methanol maser selected star-forming clumps. The observed N2H+ (1–0), HCN(1–0) and HNC(1–0) towards 82/83 clumps (99 per cent), and CH3OH(2–1) towards 78/83 clumps
(94 per cent) are combined with previous measurements of HCO+ (1–0), H13CO+ (1–0) and CH3CN(5–4) and (6–5) in the analysis. Large difference was found between sources with and without 8.6GHz continuum emission and sources with and without CH3CN lines. Thermal CH3OH is brighter and more abundant in sources with radio continuum emission and sources with CH3CN lines. 8.6GHz sources are more massive clumps associated with UCHII regions.
Opinions: CH3OH lines could be used as a crude molecular clock for single dish observations. CH3OH can be enhanced chemically in hot cores of SFRs through grain evaporation and in outflow bubble walls through grain sputtering by low-velocity shocks.
- ----------------Sulfur chemistry ---------------- (back to top)
- (Turner, 1995ApJ...455..556T)
Facts: He surveyed SO and SO2 in a sample of 21 translucent cores (Clemens-Barvainis translucent objects) using the ARO 12m telescope. He found high [SO/H2] = 10^-8~10^-7 and the abundance ratio [SO/SO2] = 1~15.
Opinions: The abundances can be explain only by gas phase chemistry, but not grain surface or shock chemistry.
- (Charnley, 1997ApJ...481..396C)
Facts: The chemistry of sulfur-bearing molecules that result from grain-mantle evaporation into warm gas in a hot core is
described. The gas phase reaction route is H2S => S => SO => SO2 in oxygen rich environments.
Opinions: If all sulfur is initially in H2S ice on grains. Warm-up will evaporate all H2S into gas phase and they are converted into SO, SO2, CS, OCS and H2CS. [SO/H2S] and [SO/SO2] abundance ratios can be used as a rough molecular clock since the disruption of the grain ice mantle ([SO/H2S] decrease with time, [SO/SO2] increases with time). Atomic S also can attain high abundance. However, the hot core chemistry alone can not explain the sulfur chemistry ([H2S] ~ [SO] ~ [SO2]/2) in Sgr B2M.
- (Hatchell et al., 1998A&A...338..713H)
Facts: They observed some sulfur species in 8 hot cores using JCMT. Using the sulfur chemistry model of Charnley (1997ApJ...481..396C) with an updated H2S+H reaction rate, they can reproduce the observed sulfur species abundances (H2S, SO and SO2), except OCS and H2CS.
Opinions: A H2S abundance of 10^-7 instead of 10^-9~10^-8 in the grain mantle is preferred. The observed sources are of similar ages of 10^4~10^5 yr.
- (van der Tak et al., 2003A&A...412..133V)
Facts: Sulfur species are observed in 9 MSFRs using JCMT, IRAM 30m and CSO. 10-50% of SO and SO2 emission arises from high-velocity gas. Tex = 25 K for H2S, 50 K for SO, H2CS,
NS and HCS+, and 100 K for OCS and SO2. Abundances are ~10^-8 for OCS, ~10^-9 for H2S, H2CS, SO and SO2, and ∼10^−10 for HCS+ and NS. However, in inner envelope where T > 100K, SO2 is enhanced by a factor of 100~1000. Source-to-source variation of abundances does not correlate with heating tracers.
Opinions: Most of the lines trace outer cooler envelope (T<100 K) of the SFRs, except some high excitation lines of OCS and SO2. The observed abundances are consistent with icy dust evaporation model of sulfur. Without high excitation lines of H2S and SO lines, they do not trace evolutionary status of the SFRs. OCS might be the carrier of sulfur on grains.
- (Wakelam et al., 2004A&A...413..609W)
Facts: The low mass SFR L1689N was mapped in SO, SO2 and H2S lines in large scale using IRAM 30m and SEST telescopes to study sulfur chemistry. Previous observations of SiO and H2CO are also collected. They found that when SiO is strong, SO2, H2S and H2CO are non-detection, while SO is only marginally detected; when SiO is weaker, SO2 is greatly enhanced w.r.t. SO.
Opinions: SiO is the best shock tracer. SO2 is enhanced w.r.t. SO in shock regions. However, SO2 lifetime is short and thus in an older shock that is traced by strong SiO emission, SO2/SO is smaller. They propose an aging sequence of the sulfur species for low mass star formation: 0 age (H2S, H2CO, SiH2, SiH4) => 10^3 yr (produce SO, SO2, H2S, SiO) => 3x10^4 yr (destruct SO2, H2CO) => 10^5yr (destruct SiO). The simultaneous presence of SO, SO2, H2S, H2CO, and SiO would mark a young shocks (<10^4yr), while the only presence of SiO points to old shocks (>3x10^4yr).
- (Wakelam et al., 2004A&A...422..159W)
Facts: A new time-dependent sulfur chemistry model is developed to include updated reaction rate coefficients for gas phase reactions after the evaporation of sulfur from heated grains. They showed that the S-bearing molecular line ratios are critically dependent upon gas temperature, gas density, atomic oxygen abundance, and most importantly, the form of sulfur injected into the gas phase (H2S, S, S2, S8, OCS or H2SO4.H2O?) which is poorly known. Most of their S reaction rates are from NSM database (“new standard model”; http://www.physics.ohio-state.edu/∼eric/research−files/cddata.july03)
Opinions: S-bearing molecules ratios can not be easily used as chemical clock! However, detailed observations and modeling can give hints on the source age and grain mantle composition. Comparison of observations and models of Orion and IRAS 16293-2422 indicates that the sulfur is very possibly mainly in atomic form in the grain mantles or at least soon after the evaporation from the grains.
- ----------------CH3OCH3 chemistry ---------------- (back to top)
- Dimethyl ether (DME) was first detected in space by Snyder et al., 1974ApJ...191L..79S in OMC, then confirmed by Winnewesser & Gardner, 1976A&A....48..159W in Sgr B2 and by more observations by Clark et al., 1979ApJ...229..553C in OMC.
- (Blake et al., 1987ApJ...315..621B)
Facts: They observed mm lines of OMC-1 and interpreted the results by gas phase ion-molecule chemistry.
Results: Beside other conclusions, they proposed that CH3OCH3 can be formed in gas phase from CH3OH.
- (Peeters et al., 2006A&A...445..197P)
Facts: They measured the photodestruction rate of CH3OCH3 in experiments and scaleed it to conditions in space. They also performed chemical modeling to check if the gaseous formation of it from CH3OH or the formation of it on icy grains is the major path in dense clouds.
Results: They found that the lifetime of dimethyl ether is 54s in the laboratory, 5.8 yrs in diffuse ISM, 0.82 Myr in dense cores and only 64 min at 1 AU from the Sun.
Conclusions: The long lifetime in dense cores means that CH3OCH3 may survive the average lifetime (~10^6 yr) of a dense cloud.
Through the gas phase reaction, the CH3OCH3 abundance is usually much lower than its parent species CH3OH. The only way to produce CH3OCH3/CH3OH ~ 1, as observed in some rare cases, is the release of CH3OCH3 from dust grains that are CH3OH poor in the icy grain mantle. However, the majority of observations support the fast gas phase reaction as the major path to form CH3OCH3, while grain surfice reactions at most plays a minor role. (more observations are called to confirm this point.)
- (Garrod & Herbst, 2006A&A...457..927G)
Facts: They proposed that in a key stage of the star formation when the protostellar cores begin to warm up to 100K or higher, the grain surface H atoms tend to evaporate rather than to react. Thus surface chemistry involving heavy radicals become important.
Results: The complex species such as methyl formate, formic acid, and dimethyl ether can be produced in large
abundance during the protostellar switch-on phase, but that both grain-surface and gas-phase processes help to produce most species.
The longer the timescale for protostellar switch-on, the more important the surface processes. (see a more detailed description here.)
- (Fontani et al., 2007A&A...470..639F)
Facts: They observed several emission lines of two Nitrogen-bearing (C2H5CN and C2H3CN) and two Oxygen-bearing (CH3OCH3 and HCOOCH3) molecules towards a sample of well-known hot molecular cores to study the N and O species differentiation.
Conclusions: The Trot, Ncol, Abundances of C2H5CN, C2H3CN and CH3OCH3 are found to be in the ranges of 100-150K, 10^15-10^17 cm^-2, and 10^-9-10^-10. Their abundances are correlated and their column densities increase with H2 column densities. Thus no N- and O-species differentiation is seen in the single dish observations of this sample of hot molecular cores, perhaps due to the lack of spatial resolution.
- (Friedel & Snyder, 2008ApJ...672..962F)
Facts: They observed several molecular species toward Orion-KL with CARMA at 1mm.
Conclusions: Ethyl cyanide [C2H5CN] and vinyl cyanide [C2H3CN] originate from multiple cores near the Orion hot core and IRc7. In addition they show that dimethyl ether [(CH3)2O] and methyl formate [HCOOCH3] originate from IRc5 and IRc6 and that acetone [(CH3)2CO] originates only from areas where both N-bearing and O-bearing species are present. They also give the formulae to compute critical densities of the organic species. (Note the differentiation of N- and O-rich cores!!)
- ----------------CH3CH2CN chemistry ---------------- (back to top)
- (Johnson et al., 1977ApJ...218..370J)
Facts: They detected methyl cyanide (CH3CH2CN) in space (in OMC-1 and Sgr B2) for the first time. They also performed laboratory studies of its rotational spectra above 41 GHz.
Results: CH3CH2CN has a rotational temperature of Trot = 90K in OMC-1, but its Vlsr = 4.5 +-1.0 km/s is different from the 8.5 km/s of most other detected molecular lines. The column density of 1.8 x 10^14 cm^-2 in OMC-1 is surprisingly high and 2 times higher than in Sgr B2.
Conclusions: Methyl cyanide can be used as a probe of chemistry in molecular clouds.
- (Minh & Irvine, 1991Ap&SS.175..165M)
Facts: They tried to observe methyl cyanide (CH3CH2CN) 2(02)-1(01) transition in two cold, dark clouds TMC-1 and L134N.
Results: CH3CH2CN was not detected in either sources, while vinyl cyanide (CH2CHCN) line was detected. The upper limit of CH3CH2CN column density is 3 x 10^12 and 2 x 10^12 cm^-2 in the two clouds, respectively.
Conclusions: Comparison of the abundances of CH3CH2CN and CH2CHCN indicates that gas phase ion-molecule chemical models are enough to explain the chemistry in the two clouds, with out the need of grain surface synthesis.
- (Miao & Snyder, 1997ApJ...480L..67M)
Facts: They mapped methyl cyanide (CH3CH2CN) in Sgr B2 (N-LMH) using BIMA and ARO12m.
Results: The CH3CH2CN emission originates in hot dense core. Its abundance is 50 times higher than in Sgr B2 (M), demonstrating that the enrichment of methyl cyanide and other complex/saturated species is due to the mantle evaporation young hot molecular cores.
- (Mehringer et al., 2004ApJ...608..306M)
Facts: They detected methyl cyanide (CH3CH2CN) rotational lines in its vibrational state Vb = 1 in-plane bending state and the Vt = 1 torsional state in the Sgr B2(N-LMH) source.
Conclusions: Because the vibrational states are 300K above the ground state, methyl cyanide could be a usful probe of hot molecular cores.
- (Ramijian et al., 2004ApJ...617..384R)
Facts: They have surveyed the high-mass Galactic star-forming regions G19.61-0.23, G45.47+0.05, and W75N for
interstellar methanol (CH3OH), formic acid (HCOOH), acetic acid (CH3COOH), methyl formate (HCOOCH3),
methyl cyanide (CH3CN), and ethyl cyanide (CH3CH2CN) with BIMA.
Results: New detection of HCOOH in the hot cores of G19.61-0.23 and W75N; new detection of CH3CH2CN and HCOOCH3 toward G19.61-0.2; HCOOCH3 toward W75N.
Conclusions: W75N showes a N and O differentiation as seen toward the Orion Hot Core and Compact Ridge and W3(OH) and W3(H2O). G45.47+0.05 does not contain hot core and its chemistry might be similar to cold dark clouds. The formation of CH3COOH appears to favor HMCs with well-mixed N and O. Most large organic species have similar abundances as CH3CN, which can be used to predict the detectability of them from CH3CN strength.
- (Demyk et al., 2007A&A...466..255D)
Facts: They computed the rotational line frequencies for isotopic methyl cyanide (13CH3CH2CN, CH313CH2CN, CH3CH213CN, ) rotational lines.
Conclusions: Hundreds of the computed lines have been identified in the spectra of Orion IRc2 IRAM survey, which demonstrates that many unidentified lines actually belong to the isotopologues of methyl cyanide.
- (Fontani et al., 2007A&A...470..639F)
Facts: They observed several emission lines of two Nitrogen-bearing (C2H5CN and C2H3CN) and two Oxygen-bearing (CH3OCH3 and HCOOCH3) molecules towards a sample of well-known hot molecular cores to study the N and O species differentiation.
Conclusions: The Trot, Ncol, Abundances of C2H5CN, C2H3CN and CH3OCH3 are found to be in the ranges of 100-150K, 10^15-10^17 cm^-2, and 10^-9-10^-10. Their abundances are correlated and their column densities increase with H2 column densities. Thus no N- and O-species differentiation is seen in the single dish observations of this sample of hot molecular cores, perhaps due to the lack of spatial resolution.
- (Friedel & Snyder, 2008ApJ...672..962F)
Facts: They observed several molecular species toward Orion-KL with CARMA at 1mm.
Conclusions: Ethyl cyanide [C2H5CN] and vinyl cyanide [C2H3CN] originate from multiple cores near the Orion hot core and IRc7. In addition they show that dimethyl ether [(CH3)2O] and methyl formate [HCOOCH3] originate from IRc5 and IRc6 and that acetone [(CH3)2CO] originates only from areas where both N-bearing and O-bearing species are present. They also give the formulae to compute critical densities of the organic species. (Note the differentiation of N- and O-rich cores!!)
- (Brauer et al., 2009ApJS..184..133B)
Facts: They computed the predicted rotational line frequencies in the ground vibrational states for methyl cyanide and extended the frequency coverage up to 1.6 THz.
- (Margules et al., 2009A&A...493..565M)
Facts: They computed rotational spectrum of deuterated and 15N ethyl cyanides: CH_3CHDCN and CH_2DCH_2CN and of CH_3CH_2C15N. To help on this task, they did laboratory measurements of more than 300 lines were identified for each species, for J values in the range 71-80 and Ka values in the range 28-31.
Conclusions: Rotational spectrum (lines frequencies and intensities) in the 4-1000 GHz frequency range and for J and Ka up to 80 and 31, respectively, is predicted. With the help of the computation, they also identified CH_3CH_2C15N in space for the first time in the IRAM 30m data of Orion. The Ncol and Tex are 10^13 cm^-2 and 150K in the plateau and 3x10^14 cm^-2 and 300K in the hot core, respectively. The deuterated species were searched for but not detected, with an upper limit of Ncol = 10^14 cm^-2.
- (Fortman et al., 2010ApJ...714..476F)
Facts: They used an alternative approach based on experimental, intensity-calibrated spectra taken at many temperatures to predict the rotational lines of CH3CH2CN on its low lying excited vibrational and torsional states between 570 and 645 GHz.
- (Fortman et al., 2010ApJ...725.1682F)
Facts: They report an extension of a previously reported experimental method for the identification and characterization of astrophysical weeds in millimeter and submillimeter spectra and present the spectral of CH3CH2CN in the widely used 210-270 GHz atmospheric window. At a temperature of 300K, the transitions involves 40 vibrational states.
- ----------------CH3OCHO or HCOOCH3 chemistry ---------------- (back to top)
- (Brown et al., 1975ApJ...197L..29B)
Facts: They detected the 1(10)-1(11) A-state transition of methyl formate HCOOCH3 in space in Sgr B2 for the first time. The measured Vlsr = 53+-6 km/s. The line is suspected to be a maser.
- (Churchwell & Winnewisser, 1975A&A....45..229C)
Facts: They detected the 1(10)-1(11) transition of both A- and E-states of methyl formate HCOOCH3 in space in Sgr B2 for the first time. The measured Vlsr = 53+-6 km/s. The line is suspected to be a maser.
- (Churchwell et al., 1980ApJ...241L.169C)
Facts: They observed methyl formate HCOOCH3 lines and detected 4 lines in Orion KL, two lines in Sgr B2 and one line in W51. The abundance is found to be surprisingly high: 2-5x10^14 cm^-2 in all three clouds. But it was not detected in other clouds.
- (Horn et al., 2004ApJ...611..605H)
Facts: They performed quantum chemical study and experimental study of the formation of methyl formate from methanol through gas phase ion-molecule reactions.
Results: HCOOCH3 is the product of the ion-molecule reation between [CH3OH2]+ and H2CO.
Conclusions: The gas phase reaction is not sufficient to reproduce the observed high abundances of HCOOCH3 in space.
- (Ramijian et al., 2004ApJ...617..384R)
Facts: They have surveyed the high-mass Galactic star-forming regions G19.61-0.23, G45.47+0.05, and W75N for
interstellar methanol (CH3OH), formic acid (HCOOH), acetic acid (CH3COOH), methyl formate (HCOOCH3),
methyl cyanide (CH3CN), and ethyl cyanide (CH3CH2CN) with BIMA.
Results: New detection of HCOOH in the hot cores of G19.61-0.23 and W75N; new detection of CH3CH2CN and HCOOCH3 toward G19.61-0.2; HCOOCH3 toward W75N.
Conclusions: W75N showes a N and O differentiation as seen toward the Orion Hot Core and Compact Ridge and W3(OH) and W3(H2O). G45.47+0.05 does not contain hot core and its chemistry might be similar to cold dark clouds. The formation of CH3COOH appears to favor HMCs with well-mixed N and O. Most large organic species have similar abundances as CH3CN, which can be used to predict the detectability of them from CH3CN strength.
- (Ramijian et al., 2005ApJ...626..233R)
Facts: They tried to observe organic molecules acetaldehyde (CH3CHO), acetic acid (CH3COOH), dimethyl ether (CH3OCH3), ethanol (CH3CH2OH), formic acid (HCOOH) and methyl formate (HCOOCH3) and so on in the PPN CRL 618.
Results: They detected CH3CN and other cyanides, but none of the organic species.
- (Garrod & Herbst, 2006A&A...457..927G)
Facts: They proposed that in a key stage of the star formation when the protostellar cores begin to warm up to 100K or higher, the grain surface H atoms tend to evaporate rather than to react. Thus surface chemistry involving heavy radicals become important.
Results: The complex species such as methyl formate, formic acid, and dimethyl ether can be produced in large
abundance during the protostellar switch-on phase, but that both grain-surface and gas-phase processes help to produce most species.
The longer the timescale for protostellar switch-on, the more important the surface processes. (see a more detailed description here.)
- (Bisschop et al., 2007A&A...465..913B)
Facts: They performed a submillimeter line survey of complex organic molecules in 7 massive YSOs to study their origin through grain surface chemistry. Source sizes and H2 column densities are computed from 850um continuum data.
Results: They devide the molecules into two groups: cold (Trot<100K) and hot (Trot>100K). The cold group includes: CH2CO, CH3CHO, HCOOH and CH3CCH; the hot group includes: H2CO, CH3OH, C2H5OH, HNCO, NH2CHO, CH3CN,
C2H5CN, HCOOCH3, and CH3OCH3. The hot O-bearing species show correlations.
Conclusions:
1) the hot molecules are `first generation' species produced by solid state chemistry in very similar conditions (O-bearing spicies abundances are correlated, but not with N-bearing species);
2) the cold molecules are also formed by solid state reactions but be destroyed at higher temperature;
3) A low level of non-thermal desorption by cosmic rays can explain their low rotation temperatures and relatively low abundances in the gas phase compared to the solid state;
4) CH3CCH abundances can be fully explained by low temperature gas phase chemistry;
5)
No cold N-containing molecules are found.
- (Bottinelli et al. 2007A&A...463..601B)
Facts: They performed a millimeter line survey of complex organic molecules (HCOOH, HCOOCH3, CH_3OCH3, CH_3CN and C_2H_5CN) in a sample of hot corinos (the inner region surrounding Sun-like protostars) to study their origin in the low mass star formation processes.
Results: They detected HCOOCH3 and/or CH_3CN towards the two class 0 protostars, NGC 1333-IRAS4B and NGC 1333-IRAS2A. They find that abundance ratios of O-bearing molecules to methanol or formaldehyde in hot corinos are comparable and about unity, and are relatively (depending on how the ratios are determined) higher than those in hot cores and in Galactic center clouds. The abundances do not depend on source luminosities.
Conclusions: Complex species are common in hot corinos.
- (Kobayashi et al., 2007ApJ...657L..17K)
Facts: They assigned 20 unidentified lines of Orion KL in literature to rotational lines of methyl formate in vibrationally vt=1 state. This is the first detection in space of the vt=1 state.
Results: They derived Tk = 44+- 10K and Ncol = 8.6+-3.2 x 10^14 cm^-2.
- (Friedel & Snyder, 2008ApJ...672..962F)
Facts: They observed several molecular species toward Orion-KL with CARMA at 1mm.
Conclusions: Ethyl cyanide [C2H5CN] and vinyl cyanide [C2H3CN] originate from multiple cores near the Orion hot core and IRc7. In addition they show that dimethyl ether [(CH3)2O] and methyl formate [HCOOCH3] originate from IRc5 and IRc6 and that acetone [(CH3)2CO] originates only from areas where both N-bearing and O-bearing species are present. They also give the formulae to compute critical densities of the organic species. (Note the differentiation of N- and O-rich cores!!)
|
| |
(back to top) |
![]()