|
Reference Data
Handbook of Space Astronomy *
Table of contents:
Astronomical
Constants (Also available: MS
Word version and PDF version) [ back to top ]
1 Debye = 10^-18 (StatC cm) = 1/299792458 * 10^-21 (C m)
1 u = 1 amu = 1.660538921(73)×10^−27 kg (unified atomic mass unit, from wikipedia: http://en.wikipedia.org/wiki/Atomic_mass_unit)
Coulomb's constant in free space: ke = 1/(4 pi epsilon_0) = 8.9875517873681764 * 10^9 N m^2 C^-2 (Wikipedia: http://en.wikipedia.org/wiki/Coulomb's_constant)
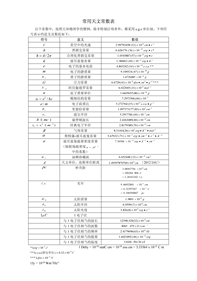
Periodic table of elements [ back to top ]
Elemental
abundance of the Solar system [ back to top ]
- Solar abundance (mass fraction) is available from RRSN or from paper by Anders & Grevesse 1989.
Here is a PDF copy of the table.
-
Solar abundance from Wikipedia, see original Wiki entry or table below:
- They compiled elemental abundances in meterites, solar atmosphere, and solar corona. (from Anders & Grevesse, 1989GeCoA..53..197A)
(tabs: left to right -- elemental abundances in the solar atmosphere, corona, meteorites and isotopic ratios)
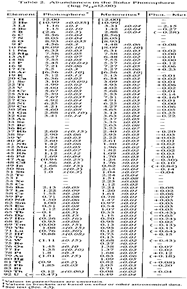 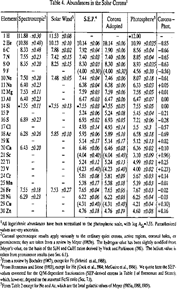 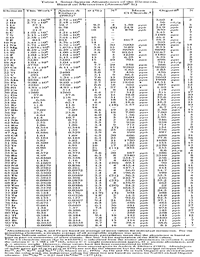 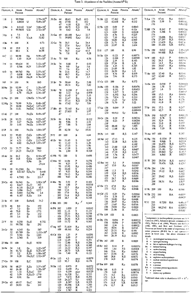
Table of elements and their abundance measured in number of atoms found per
1,000,000 atoms of silicon.
| Element |
Abundance (Si=1×10⁶) |
| H |
2.43×10¹⁰ |
| He |
2.343×10⁹
|
| Li |
55.47 |
| Be |
0.7374 |
| B |
17.32 |
| C |
7.079×10⁶ |
| N |
1.950×10⁶ |
| O |
1.413×10⁷ |
| F |
841.1 |
| Ne |
2.148×10⁶ |
| Na |
57510 |
| Mg |
1.020×10⁶ |
| Al |
84100 |
| Si |
1.000×10⁶ |
| P |
8373 |
| S |
444900 |
| Cl |
5237 |
| Ar |
102500 |
| K |
3692 |
| Ca |
62870 |
| Sc |
34.20 |
| Ti |
2422 |
| V |
288.4 |
| Cr |
12860 |
| Mn |
9168 |
| Fe |
838000 |
| Co |
2323 |
| Ni |
47800 |
| Cu |
527 |
| Zn |
1226 |
| Ga |
35.97 |
| Ge |
120.6 |
| As |
6.089 |
| Se |
65.79 |
| Br |
11.32 |
| Kr |
55.15 |
| Rb |
6.572 |
| Sr |
23.64 |
| Y |
4.608 |
| Zr |
11.33 |
| Nb |
0.7554 |
| Mo |
2.601 |
| Ru |
1.900 |
| Rh |
0.3708 |
| Pd |
1.435 |
| Ag |
0.4913 |
| Cd |
1.584 |
| In |
0.1810 |
| Sn |
3.733 |
| Sb |
0.3292 |
| Te |
4.815 |
| I |
0.9975 |
| Xe |
5.391 |
| Cs |
0.3671 |
| Ba |
4.351 |
| La |
0.4405 |
| Hf |
0.1699 |
| Ta |
0.02099 |
| W |
0.1277 |
| Re |
0.05254 |
| Os |
0.6738 |
| Ir |
0.6448 |
| Pt |
1.357 |
| Au |
0.1955 |
| Hg |
0.4128 |
| Tl |
0.1845 |
| Pb |
3.258 |
| Bi |
0.1388 |
| Ce |
1.169 |
| Pr |
0.1737 |
| Nd |
0.8355 |
| Sm |
0.2542 |
| Eu |
0.09513 |
| Gd |
0.3321 |
| Tb |
0.05907 |
| Dy |
0.3862 |
| Ho |
0.08986 |
| Er |
0.2554 |
| Tm |
0.0370 |
| Yb |
0.2484 |
| Lu |
0.03572 |
| Th |
0.03512 |
| U |
9.31×10⁻³ |
Elemental
abundance of human body (from Wikipedia, see original Wiki
entry) [ back to top ]
The human body is a combination of elements and compounds. The average adult
(specifically a 70 kilogram adult) is composed of the following: (but I don't know that the "Percentage" is!)
Elemental
abundances in an AGB star: [ back to top ]
See the website of Dr. Amanda Karakas here for elemental abundances in an AGB star.
CNO cycle:
Mainly produce 4He from 1H.
12C/13C ratio in CNO equillibrium is 3.5, which is lower than solar value of 89.
14N has the largest number density among C, N, O. So the
12C/14N is also lower than solar value (...?)
(from Wikipedia)
PP chain:
mainly produce 4He, also some 3He,
2H, 7Be, 8Be, 8B, 7Li
(from Wikipedia)
Triple-alpha process:
mainly produce 12C and further form 16O, also a little 8Be.
Terrestrial
isotopic ratios: (from Duley &
Williams, 1984inch.book.....D) [ back to top ]
H/D = 6701
12C/13C = 89
14N/15N = 269
16O/18O = 489
16O/17O = 2675
32S/34S = 23
32S/33S = 124
28Si/29Si = 20
Knowledge of isotopes: [ back to top ]
The Berkeley Laboratory Isotopes Project: provide half-life, spin, parity, decay mode or abundance of all isotopes of all elements.
Spectral line lists: [ back to top ]
- UV-IR: Peter van Hoof
atomic line list: 0.5 A ~ 1000um, for
allowed, intercombination and forbidden atomic transitions.
-
IR: Per
van Hoof list of HI, DI and HeII lines: 1um ~
196um. (a local copy made
on Dec. 19, 2008)
-
IR: Dieter
Lutz line list: 1.9um ~ 206mu, for
potentially bright atomic and ionic fine structure lines. (a local copy made on Dec. 19, 2008)
-
IR: Ewine
van Dishoeck list of IR molecular lines: 2.4um ~
187um, for H2, HD, H2O, OH and CO. (a local
copy made on Dec. 19, 2008)
-
IR: selected
IR mol lines: 50um ~ 200um, for CO, 13CO, OH, 18OH, CH, NH3, HD and HeH+. (a local copy made on Dec.
19, 2008)
-
IR: H2
lines: 2.49um ~ 28.22um. (a local copy made on Dec. 19, 2008)
-
IR: CO
lines: 50um ~ 200.3um. (a local copy made on Dec. 19, 2008)
-
IR: HF
lines: 48um ~ 122um. (a local copy made on Dec. 19, 2008)
-
IR: H35Cl
lines: 44um ~ 160um. (a local copy made on Dec. 19, 2008)
-
IR: H37Cl
lines: 44um ~ 160um. (a local copy made on Dec. 19, 2008)
-
mm: DiRef database - on-going updated version of Huber and Herzberg's classic book
"Constants of Diatomic Molecules." (need a free account for
access.)
-
mm: JPL
linelist
-
mm: CDMS
linelist
-
mm: splatalogue - a molecular
linelist dedicated to ALMA.
-
mm: NIST
Lovas linelist - frequencies from obervations.
Basic facts of the ecosystem of the Milky Way Galaxy [ back to top ]
- Morphology:
- Thin disk radius = 25-30 kpc (Binney and Merrifield, 1998gaas.book.....B, cited by Ferriere, 2001RvMP...73.1031F)
- Thin disk effective thickness = 400-600 pc (Binney and Merrifield, 1998gaas.book.....B, cited by Ferriere, 2001RvMP...73.1031F)
- Spherical bulge radius = 2-3 kpc (Binney and Merrifield, 1998gaas.book.....B, cited by Ferriere, 2001RvMP...73.1031F)
- Spherical halo radius > 30 kpc (Binney and Merrifield, 1998gaas.book.....B, cited by Ferriere, 2001RvMP...73.1031F)
- Sun-GC distance = 8.5 kpc (Kerr and Lynden-Bell, 1986MNRAS.221.1023K)
- Sun-Galactic disk distance = 15pc (above) (Cohen, 1995ApJ...444..874C)
- H2 scale height (FWHM along Z axis) = 120+-18pc (Bronfman et al., 1988ApJ...324..248B)
- Kinematics
- Composition
- Elemental abundances (by number density): H (90.8%), He (9.1%), metal (0.12%).
- ISM mass: ~10-15% of the Galactic disk mass, with half of which located in ~1-2% of volumn. (Ferriere, 2001RvMP...73.1031F)
- Average ISM density in the solar neighborhood = 2.7x10^-24 g/cm3 =~ 1 H/cm3. (Ferriere, 2001RvMP...73.1031F)
- Average molecular weight = 1.42 m_H (Ferriere, 2001RvMP...73.1031F)
- Ionization degrees: electron abundance
- Thermodynamics
- Dynamics and timescales
- Interstellar clouds are almost always in a critical state between self gravity and B-field. Collapse of clouds during star formation is almost always proceeding at 1~2 times of dynamical time scales (crossing time) tdyn=(Gρ)-1/2 = 61 n-1/2 Myr (for H2 number density n). However, tdyn is very different at various size scales of the collapse clouds.
- 10^8-10^9 yr: conversion of all molecular gas into stars with the current star formation rate
- 240 Myr: Galaxy rotation period at the position of the Sun
- 60 Myr: tranverse time from one spiral arm to the next for the Sun (four arm spirals)
- 30 Myr: Spiral arm traverse timescale of the Sun
- 10-20 Myr: OB association formation
- 5-10 Myr: OB star cluster formation
- 3 Myr: dense OB cluster formation
- 0.5 Myr: individual star formation
- Stars
- Supernova rates in galaxies: 0.41h SNu for Type Ia and 1.69h SNu for Type Ib+Ic+II (h =0.7 is the Hubble constant in units of 100km/s/Mpc, SNu is the supernova unit of 1 SN per 10^10 (L_B)_sun per 100 yr). Assuming MWG is a Sbc galaxy with a blue luminosity of 2.3x 10^10 (L_B)_sun, we have Galactic SN rates: 1/220 yr for Type Ia; 1/50 yr for Type Ib+Ic+II.
Maps of the Galaxy [ back to top ]
-
A complete CO, 1-0 line survey of the whole Galaxy is presented. They observed some parts and
merged it with previous survey results. The spatial CO map and longitude-velocity maps are present as high resolution figures.
(from Dame et al., 2001ApJ...547..792D)
(figure: left -- low resolution CO, 1-0 map of the whole galaxy; right -- the
longitude-velocity map of the CO, 1-0 Galaxy map. Warning: clicking each small figure will open a very big
image file of up to 2MB!!)
 
Also see the web link of the survey here: http://www.cfa.harvard.edu/mmw/MilkyWayinMolClouds.html.
Another web based query graphic interface (Skyview) also provide this data: http://skyview.gsfc.nasa.gov/cgi-bin/query.pl.
Fits file of the above integrated CO map can downloaded here. A way to obtain original high resolution l-b-v fits data cube is also privided in this page.
Interstellar extinction [ back to top ]
- (Drimmel et al., 2003A&A...409..205D)
They have given a 3-D Galactic extinction model based on dust distribution model. They also give Fortran and IDL programs (see FTP link: HERE) to automatically calculate the extinction Av for a give 3-D position: (RA,DEC,dist) or (L,B,dist) or ecliptic coordinates (Lecl,Becl,dist). There are several caveats:
- it is inaccurate for dist < several hundred pc;
- the highest resolution is 0.35deg x 0.35deg, which is limited by the COBE pixels;
- the Galactic bar and nuclear disk are not considered;
- it is inaccurate within 0.35 Rsun from the Galactic center, due to the bad geometry of the spiral arms adopted in the model;
- it is inaccurate towards the line of sight of spiral arm tangents;
- it is inaccurate towards the direction of Andromeda Galaxy, M33, the LMC and SMC, due to confusing of their background emission;
- it is inaccurate towards the Orion and rho Ophiucus complexes, due to the anormalous dust temperatures in these nearby star forming regions.
- (Marshall et al., 2006A&A...453..635M)
They used the Galaxy model to compute intrinsic NIR colors of stars and compare that with 2MASS data to determine the extinction distribution along different sight lines of the Milky Way. They also analyzed the strucutre of the MW galaxy with the new extinction distributions. (The 3D extinction database are given on Vizier, also provide plot of extinction ~ distance.)
Prominent emission lines in Spitzer IRAC bands
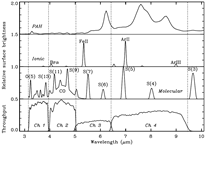
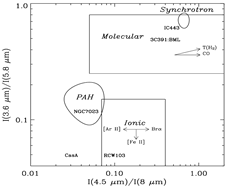
- PAH, ionic and molecular lines in the 4 IRAC bands (Reach et al., 2006AJ....131.1479R)
(fig: left -- In the 3rd panel is a combination of H2 lines and CO band head; right -- IRAC colors due to different lines, with the arrows showing the trends of increasing line strength of the marked species.)
Gerneral star catalogues [ back to top ]
Gerneral definition of magnitude
- The standard star &a; Tau is defined as zero magnitude at any wavelength. It is spectral closely resemble a blackbody with T = 10000K. Thus the zero magnitude flux at a given frequency nu is
fv(0.0 mag) =1.57 × 10^-16 × Bv(l0,000 K).
For the 4 IRAS bands fv[0.00 mag] = 28.3, 6.73, 1.19 and 0.43 Jy for 12, 25, 60 and 100 µm bands respectively. Then the magnitude can be defined as
[12] = -2.5log(F12/f12(0.0mag)) and so on.
Then, colors [12]-[25], [25]-[60], [60]-[100] can be defined.
(from Beichman, C. A., Neugebauer, G. Habing, H. J., Clegg, P. E., & Chester, T. J.
1988, Infrared astronomical satellite (IRAS) catalogs and atlases, Vol. 1,
Explanatory Supplement, 1988iras....1.....B)
- However, some authors also define the IRAS colors in a different way. E.g., [12]-[25] = 2.5 log(F25/F12) and so on. (see van der Veen & Habing, 1988A&A...194..125V)
[ back to top ]
|
 low with all visitors to my
webpages, these pages are mainly designed for my own use and subject to change
without warning. I do not guarantee the correctness of all contents as w
 ell.
ell.


