|
M-type AGB stars
Table of contents:
Molecular observations and modelling
Dust observations and modelling
High galactic OH/IR stars
Examplers of M star

Molecular observations and modelling: (back to top)
- Seven new HCN and 2 new CS detections towards O-rich stars were reported,
using OSO. The typical abundances of these carbon chemistry species in the
O-rich stars are HCN/H2 = 7x10^-7, CS/H2 = 4x10^-7, SiS/H2 =
1x10^-6. These values were obtained by assuming CO/H2 = 3x10^-4.
(from Lindqvist et al., 1988A&A...205L..15L)
- CO,1-0 and 2-1 lines were observed with IRAM
towards a sample of cold OH/IR stars to check the low CO mass loss rate
problem. They found that for OH/IR stars with optically thin CSEs the CO mass loss rate agrees with IR and OH mass loss rates,
while only for optically thick CSEs (with strong 9.8um
silicate absorption) show too low CO mass loss rate. For the cold
OH/IR stars, CO,1-0 mass loss rate is also smaller than CO,2-1 mass loss
rate by a factor of 3. Several possible reasons
of the CO emission deficiency are: 1) mass loss
increased during last 10^4 years; 2) a strong
depletion of C and so CO, but this is not seen in PNe; 3)
CO is dissociated by stonger interstellar UV field, but CO strength is not
sensitive to CSE size in the case of high mass loss rate; 4) the outer part of the CSE is very cold, or even
colder than 3K while the CO lines are optically thick, so that subtracion of
2.7K CMB background in the observation produce small brightness CO
temperature; 5) subtraction of the interstellar
emission is problematical, because the CO emission could be very extended,
the interstellar emission is not simply additive, and all massive OH/IR
stars reside on the Galactic plane. The most
possible reason could be the low CO brightness temperature. (from
Heske et al., 1990A&A...239..173H)
- Detection of CO,1-0 and 2-1 lines from two
distant OH/IR stars, OH0.3-0.2 and OH18.5 + 1.4, is reported. The CO mass loss rate is
only one half of OH mass loss rate. (from Winnberg et al., 1991A&A...245..195W)
- H2O maser is pumped in gas with T~400 K and nH2~10^9 cm^-3;
OH maser is pumped in gas with T~50 K and nH2~10^4 cm^-3.
(from Elitzur, 1992ARA&A..30...75E)
- SO is detected in 14
stars among 24 O-rich stars. SO is produced in
the CSE with abundance higher than predicted by non-equillibrium
chemistry models. S must be free from dust formation. H/H2 is small. O+SH
reaction take over S+OH. (Sahai & Wannier, 1992ApJ...394..320S)
- BIMA observations of non-maser SiO J=2-1 in IK Tau, chi Cyg and RX Boo with
resolution of 3"-4" and 7"-9" respectively showed that
the acceleration of wind mainly occurs within 10 R*,
not as large as 100 R*. There should be a fast decrease of SiO abundance
beyond (1-2)x10^15 cm which is caused first by dust formation and later by
UV photodissociation. (from Sahai et al., 1993AJ....105..595S)
- IRAM30m observations of 14 OH/IR stars showed that H2S,
SO2 and SiO molecules are homogeneous in
all kinds of O-rich CSEs. SO2 are optically
thin with Tex = 25-40K, agree to photochemistry
of SO2 in the outer CSE. H2S
show narrower line, indicating that it is confined in the inner CSE (don't know how it's destroyed). Bipolar
outflow of OH 231.8+4.2 show high Vexp. NML Cyg show
asymmetric profile in SiO and H2S. (from Omont
et al., 1993A&A...267..490O)
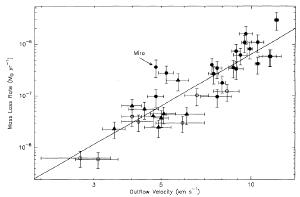
- A CSO CO 3-2 survey to a sample of nearby Mira stars (< 500pc)
found 36 CO CSEs among 66 stars. Average Vexp=7.0 km/s,
only about 1/2 of that of IR selected Miras. Stars earlier than M5.5 were
all non-detections. Vexp is anticorrelated with T*, Mlr is correlated with
IR L*, and show power law relation to Vexp, but not with IR colors.
Several stars with extended dust envelope show no CO (R Cen & R Car). (from Young, 1995ApJ...445..872Y)
(fig: Mlr-Vexp power law relation)

- IRAM 30m telescope observation of CO,1-0 line
towards a sample of IRAS O-rich sources showed that a
large group of sources do not follow the tight correlation between 60um flux
and CO line strength. The majority of the IR bright but CO weak
sources have lower galactic latitude, low IRAS variability and earlier
spectral type, therefore, they could be supergiants and the weakness of CO could be merely related to the high
luminosity of these sources. The CO molecules could have been largely
distroyed by photodissociation by the energetic photons from the star
itself. On the other hand, those sources with "normal" CO emission
(with low S60/CO ratio) should be all AGB stars. (from Josselin et al., 1996A&A...315L..23J)
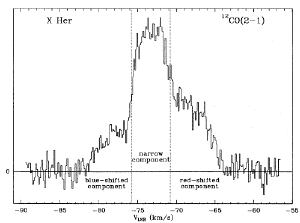
- They found composite CO line profile in the O-rich SR variable X Her,
using IRAM 30m mapping. The map indicates bipolar outflow with small viewing angle of ~ 15deg.
(from Kahane & Jura, 1996A&A...310..952K)
(fig: the composite line profile of CO
2-1.)

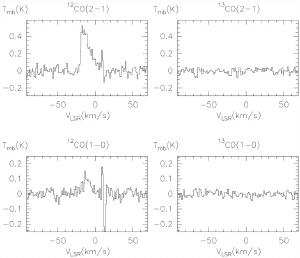
- They identified a wide binary HD 188037 (=IRC +20439) with a separation of 0.75 arcsec between an M star
and a main sequence A-type star. The UV photons
from the A type star photodissociated the CO gas from one side of the CSE of
the M star and thus resulted in an unusual skewed CO
2-1 line profile. (Strange! how can a more
massive A-type star form binary with a low mass M star?) (from Jura
et al., 1997ApJ...485..341J)
(fig: The skewed CO spectral line
profiles)

- IRAM 30m and SEST
single dish CO,2-1,1-0 line survey of a sample
of 109 IRAS color selected O-rich IR stars resulted in 54 detections. The
spectral profiles were shown. While the S60/CO ratio has been found to be
correlated with luminosity of the sources, there is no correlation with IR
color indecies and 10um silicate emission strength, which needs other
interpretations. The presence of OH maser seems to be
related to higher S60/CO ratio. (from Josselin et al., 1998A&AS..129...45J)
- They used a physio-chemical model to
reproduce carbon molecule abundances:
CS, HCN, CO2 in the O-rich Mira
IK Tau. (from Duari et al., 1999A&A...341L..47D)
- OVRO high resolution (1.7")
mapping of CO 1-0 and 2-1 to the O-rich SR variable RV Boo
(P=120-140d, dist=280-640pc, L=0.42-2.14x10^4Lsun, Mlr=0.4-2x10^-7 Msun/yr) revealed a
possible Keplerian disk like structure of 4.2"x3.3". But it could be bipolar outflow
as well. (This star has non-detection for SiO, H2O and OH masers and a
composite CO 1-0 line profile.) They found a composite
profile of CO 2-1 at the map center. (from Bergman et al., 2000A&A...353..257B)
- Observations of multiple transitions of SiO
and HCN (from levels from 26~115 K) were
reported for a sample of M, S, C type AGB stars. They were detected in
almost all sample stars. HCN 3-2 and 4-3 are found to
be bright in O-rich stars. The HCN line ratio support shock chemistry as the source of HCN in these O-rich
stars. HCN/SiO ratio increases with increasing
mass loss rate in M and S stars, and separate them from carbon stars. (from
Bieging et al., 2000ApJ...543..897B)
- ATCA high resolution mapping of SiO thermal lines in two O-rich low mass AGB
stars, R Dor and L2
Pup. Radiative transfer shows that turbulent
velocity of 1.1-1.5 km/s is necessary to reproduce the observations.
Sudden decrease of SiO abundance is expected, as a result of dust formation
and the latter occurs very close to the star (20-30 R*). (from Schoier et
al., 2004A&A...422..651S)
- They used OVRO to map HCN,1-0
in TX Cam and IK Tau,
but the didn't detected C2H or CH3OH, which
rules out the
photochemistry production route of HCN from reactions among N, CH2 and CH3.
They measured deconvolved source sizes of
4.75" and 3.85"
for TX Cam and IK Tau, respectively. The peak continuum fluxes at 96.7 GHz were 3.7+-0.4 mJy and
6.1+-0.4 mJy
for TX Cam and IK Tau, respectively. (from Marvel, 2005AJ....130..261M)
- A small SMA and NMA interferometry CO 1-0 and 2-1 survey
of OH/IR stars in Galactic center detected two
sources: OH359.971–0.119
and OH0.3–0.2. The latter source has a
very high spatial velocity of -341 km/s. (from Winnberg et al., 2006JPhCS..54..166W)
- PdBI mapped the CO 2-1 and 1-0 lines towards the O-rich AGB star EP Aql that shows composite CO
line profiles (narrow CO line on the top of a broad line). The
resolution were 1.7"x1.0" and 3.5"x1.8" respectively (~
230x135 AU and 470x240 AU at a distance of 135 pc). Their monte carlo
radiative transfer modelling reproduced the composite CO spectra with a two wind model (with slow wind at the center), but
their model can not reproduce the channel maps. (from Winters et al., 2007A&A...475..559W)
Dust observations and modelling:
(back to top)
- Bispectrum speckle interferometry of O-rich
AGB star CIT 3 showed that the mass loss was decreasing with time in the past,
while the current mass loss is steady. Parameters detemined from radiative
transfer modelling: Teff=2250K, Tau(0.55)=30, R*=10.9 mas, inner dust shell
diameter = 71.9 mas, transition radius of the mass loss phase = 135.7 R*,
Mlr = 1.3-2.1 x 10^-5 Msun/yr (for a distance = 500-800 pc.) (from Hofmann
et al., 2001A&A...379..529H)
- They discussed the indentification of 2MASS
counterpart of OH/IR stars. (from Lewis, 2001AJ....121..426L)
High galactic latitude OH/IR
stars (back to top)
- A sample of 62 high galactic latitude OH/IR stars
(|b|>10deg, |l|<90deg) were discussed. They argued that these OH/IR
stars may evolve into PPN phase as C-rich PPNs,
because very few O-rich PPNs have been seen there. (from Lewis, 2000ApJ...533..959L)
- They identified a step increase of mass loss rate
and short term changes in circumstellar
envelope that are enhanced by increased metallicity in a sample of high galactic latitude OH/IR stars. This was
interpreted as the consequence of cyclic thermal pulse.
(from Lewis, 2001ApJ...560..400L)
- High galactic latitude (|b|>10deg) OH/IR stars show well-defined
Vexp-MIR color relation, while their low latitude counterparts show
large scatter in this relation. The high galactic latitude OH/IR stars show limited MIR color range, which could be related to shorter and more extreme bursts of mass loss that is
preferable in low mass stars with Helium flashes, according to dusty
radiative transfer calculations. (from Wu &
Lewis, 2007AAS...211.5119W)
Examples of M star
(back to top)
- IRAS 01037+1219 (CIT 3, IRC
+10011) (an OH/IR star with
bipolar outflow found)
- IRAS 07399-1435 (OH 231.8+4.2, QX Pup): an extremely red OH/IR star varying
with large IR amplitude (amptitude of 0.29 mag around 25um). (Smith
et al., 2004ApJS..154..673S)
- IRAS
15445-5449 -- a water fountain star.
- IRAS
15544-5332 -- a water fountain star.
- IRAS
16342-3814
-- a water fountain star.
- IRAS 16552-3050
-- a water fountain star.
- IRAS
18043-2116 -- a water fountain star.
- IRAS
18139-1816 -- a water fountain star.
- IRAS 18286-0959
-- a water fountain star.
- IRAS 18450-0148 (W43A) -- a well known
water fountain star.
- IRAS
18460-0151 -- a water fountain star.
- IRAS 18596+0315
-- a likely water fountain star.
- IRAS
19067+0811
-- a likely water fountain star.
- IRAS 19134+2131
-- a water fountain star.
- IRAS
19190+1102
-- a likely but strange water fountain star.
- W Hya (IRAS 13462-2807)
-- a nearby O-rich Mira star.
|
![]()